 Skip to main content


Teachers, class monitors, and school administrators often need a single number that summarizes how well a group showed up over a period of time. That number is the average attendance, and the formula behind it is simpler than most people expect — yet easy to misuse.
This guide walks through the average attendance formula from the ground up: what it means, the versions used in schools and workplaces, step-by-step instructions, three fully worked examples, spreadsheet methods, the mistakes that distort results, and the situations where an average hides more than it reveals. If you are looking for what your attendance figure means for you personally, you may also want to read about what your attendance percentage really means and why it matters.
What the Average Attendance Formula Actually Means
Average attendance is the arithmetic mean of attendance values collected over a period. In the most common school version, a teacher records how many students were present each day, adds those daily counts together, and divides by the number of days. The result is the average number of students present per day.
Here is the important part: “average attendance” can be expressed two ways. It can be a headcount (an average of 27.4 students present per day) or a rate (an average attendance rate of 91.3%). The headcount version answers “how many students typically showed up?” while the rate version answers “what share of the expected attendance actually happened?” Most school reports use the rate version, because it lets you compare classes of different sizes.
The Core Formula in Plain Words
The average attendance formula appears in three common forms. They all describe the same idea, but each suits a slightly different starting point.
Form 1: Average of daily headcounts
Average Attendance = (Sum of students present each day) ÷ (Number of days)
If a class had 28, 30, 27, 29, and 26 students present across five days, the average attendance is (28 + 30 + 27 + 29 + 26) ÷ 5 = 140 ÷ 5 = 28 students per day.
Form 2: Average attendance rate
Average Attendance Rate = (Total attendances ÷ Total possible attendances) × 100
Total attendances is the sum of every student present on every day. Total possible attendances is the number of students multiplied by the number of days. Using the same five-day class of 30 students: total attendances = 140, total possible = 30 × 5 = 150, so the rate = (140 ÷ 150) × 100 = 93.33%.
Form 3: Average of individual percentages
Average Attendance = (Sum of each person’s attendance percentage) ÷ (Number of people)
This version is handy when you already have each student’s attendance percentage and want the group figure. Add up the individual percentages and divide by the number of students.
Notice what the formula never does: it never looks at attendance on a single day and calls that the average. An average, by definition, summarizes multiple observations.
Average Attendance vs Attendance Percentage: The Key Difference
This distinction trips up a surprising number of people, so it deserves its own section. An attendance percentage usually describes one person (or one class) over one period: days present divided by total days, multiplied by 100. It is a snapshot of a single entity.
The average attendance formula, on the other hand, aggregates. It combines many snapshots — many days, many students, many months — into one summary number. You can think of it this way: attendance percentages are the ingredients, and the average attendance formula is the recipe that blends them.
Why does the difference matter? Because the two can tell different stories. A class might have a respectable average attendance rate of 92% while individual students range from 100% down to 60%. The average hides the student at 60% who needs attention. Anyone who needs the individual-level math should use a dedicated walkthrough of how to calculate attendance percentage step by step rather than the averaging formulas in this guide.
How to Use the Formula: A Step-by-Step Walkthrough
Here is the general process, no matter which form you use:
Step 1: Define the period. Decide exactly which days count — a term, a month, or a custom range. Exclude holidays and days the school was closed, because including them deflates the result.
Step 2: Gather the raw data. Collect the daily present counts from the attendance register. A blank cell is not a zero — track down the real figure first.
Step 3: Add up the attendances. Sum the daily counts to get total attendances.
Step 4: Determine the divisor. For a headcount average, divide by the number of days. For a rate, divide by total possible attendances and multiply by 100.
Step 5: Round sensibly. One or two decimal places is standard.
Step 6: Sanity-check the result. A headcount average can never exceed the class size, and a rate can never exceed 100%. If your number breaks those ceilings, something went wrong in the arithmetic.
Worked Example 1: A Class of 30 Students Over 20 Days
Mrs. Sharma teaches a class of 30 students and wants the average attendance for a 20-day term. Her register shows the following daily present counts:
27, 29, 30, 28, 26, 29, 30, 27, 28, 29, 30, 28, 27, 26, 29, 30, 28, 27, 29, 28
First, she adds them up: the twenty daily counts sum to 565 total attendances.
Next, she applies Form 1 for the headcount version:
Average Attendance = 565 ÷ 20 = 28.25 students per day
For the rate version, she computes total possible attendances: 30 students × 20 days = 600. Then:
Average Attendance Rate = (565 ÷ 600) × 100 = 94.17%
So the class averaged 28.25 students present per day — a 94.17% attendance rate. The headcount is concrete; the rate is comparable across classes of any size.
Worked Example 2: One Student’s Monthly Average
Sometimes the “average attendance” question is about one person across months rather than a group across days. Rohan wants to know his average monthly attendance rate for the term. His monthly attendance percentages were:
- June: 88%
- July: 92%
- August: 95%
- September: 90%
Using Form 3, he adds the percentages and divides by the number of months:
Average = (88 + 92 + 95 + 90) ÷ 4 = 365 ÷ 4 = 91.25%
Rohan’s average monthly attendance rate is 91.25%. Simple — but there is a subtlety worth knowing. This simple average treats every month equally, even if the months had different numbers of school days. For a quick personal check, that is perfectly fine. If the figure will appear in an official report, the weighted method in the next example is more accurate.
This kind of personal tracking is also useful for spotting your own trend. If your average is drifting downward month after month, that is worth investigating long before it becomes a problem — especially if you are wondering how many classes you can afford to miss before it matters.
Worked Example 3: Weighted Average Across Two Sections
A school runs two sections of Grade 10. Section A has 40 students with an attendance rate of 95%. Section B has 25 students with a rate of 88%. What is the combined average?
The naive approach — (95 + 88) ÷ 2 = 91.5% — is wrong, because Section A has far more students. The weighted average attendance formula fixes this:
Weighted Average = [(Rate A × Students A) + (Rate B × Students B)] ÷ (Students A + Students B)
Plugging in the numbers:
= [(95 × 40) + (88 × 25)] ÷ (40 + 25) = (3,800 + 2,200) ÷ 65 = 6,000 ÷ 65 = 92.31%
The correct combined average is 92.31%, not 91.5%. The bigger section pulls the average toward its own higher rate, exactly as it should. This weighted version is the one administrators should use whenever they combine groups of different sizes.
Calculating Average Attendance in Excel and Google Sheets
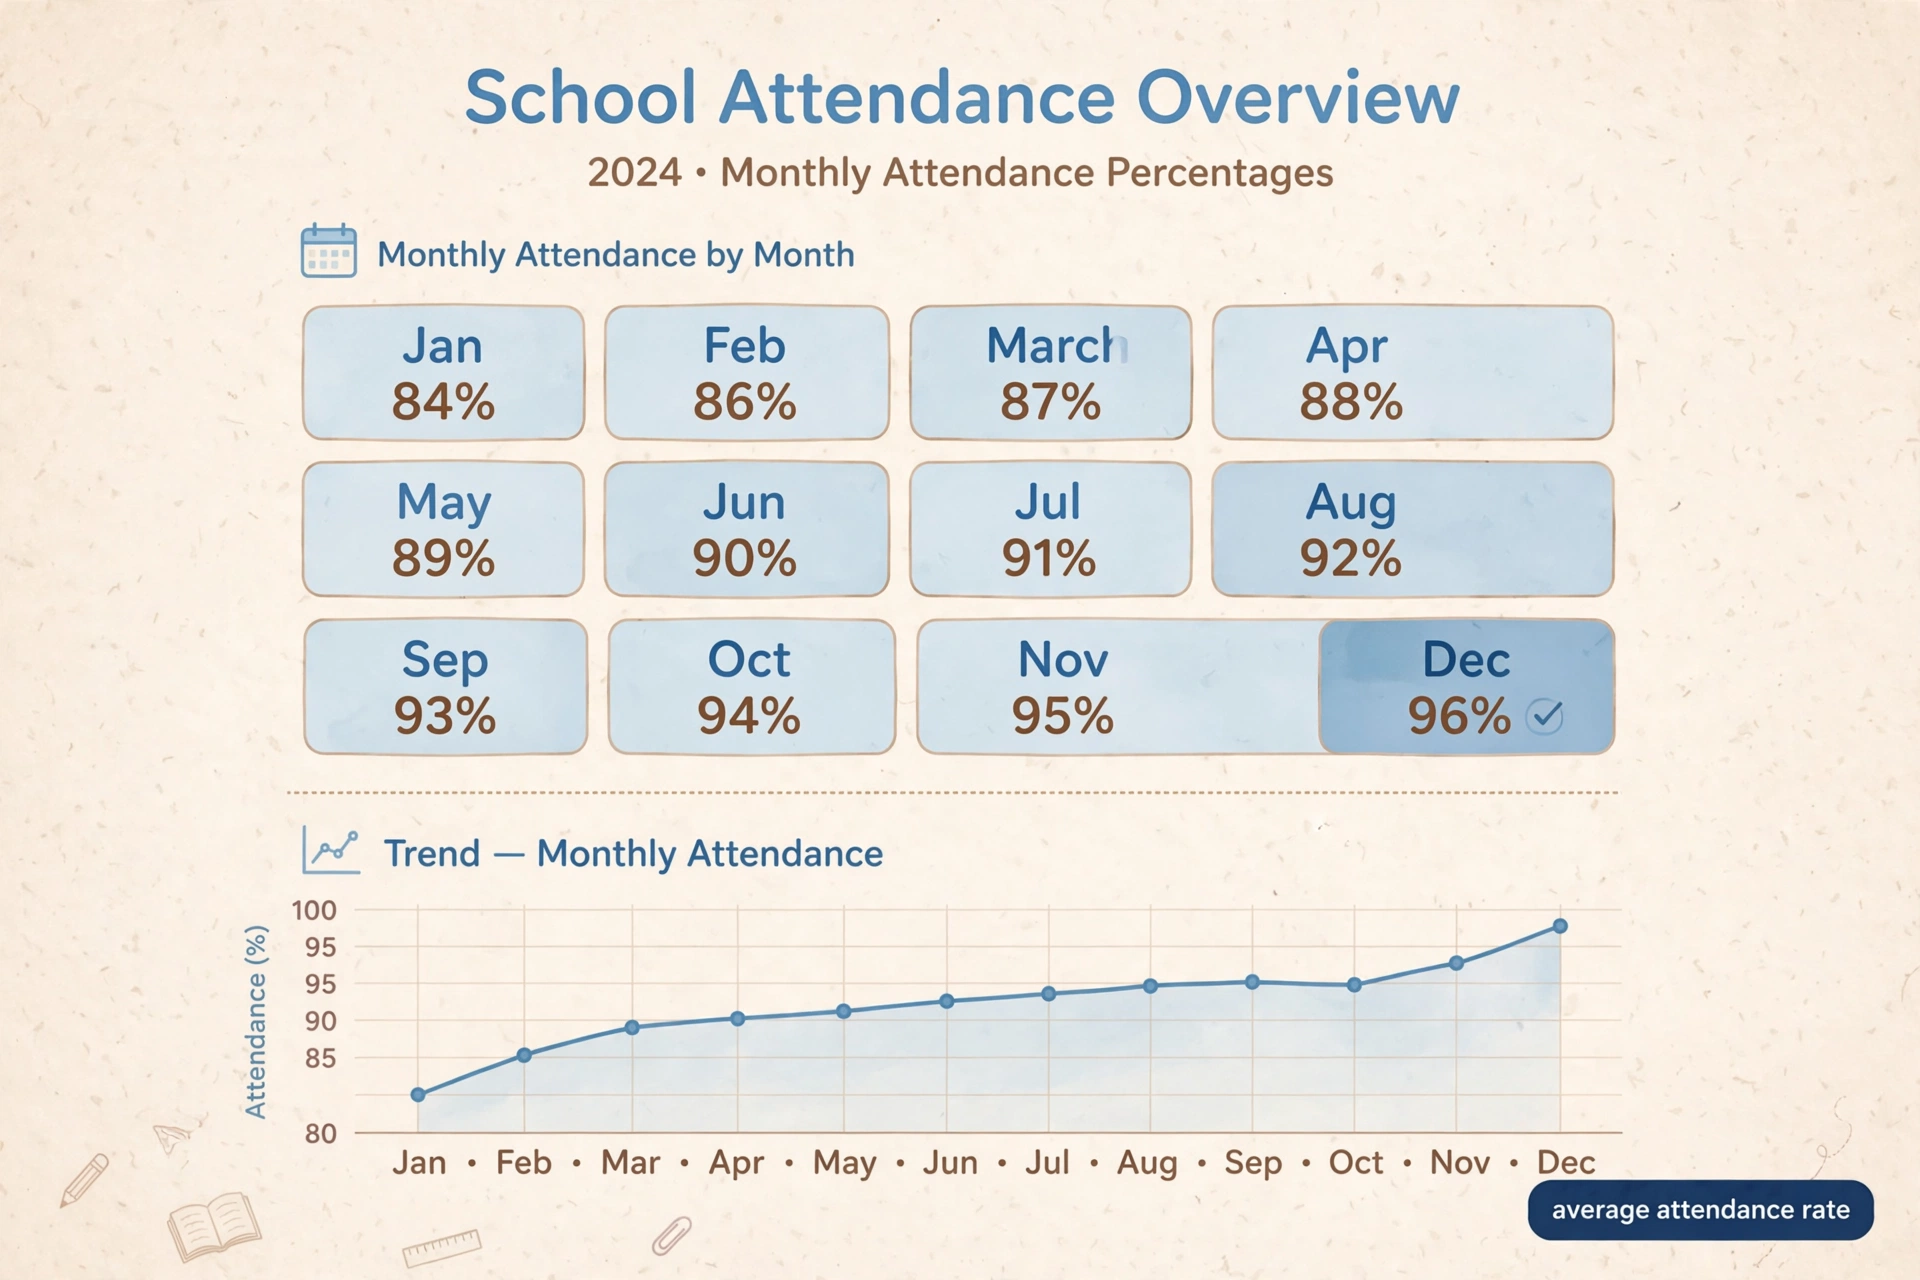
Most attendance data already lives in a spreadsheet, so it makes sense to compute the average there. The methods below work identically in Excel and Google Sheets.
Method 1: The AVERAGE function for daily counts. If daily present counts sit in cells B2 through B21, type =AVERAGE(B2:B21) in an empty cell. The function adds the values and divides by the count of numeric cells.
Method 2: Manual division for the rate. Suppose total attendances are in C22 and total possible attendances are in D22. Type =C22/D22 in another cell, then format that cell as a percentage using the toolbar’s percent button.
Method 3: AVERAGE of monthly percentages. If monthly percentages are in E2:E5, =AVERAGE(E2:E5) gives the simple average. Make sure the cells are formatted as percentages first, or the result will display oddly.
Method 4: Weighted average with SUMPRODUCT. For the two-section example, if rates are in F2:F3 and student counts in G2:G3, type =SUMPRODUCT(F2:F3,G2:G3)/SUM(G2:G3). This multiplies each rate by its weight, adds the products, and divides by the total weight in one step.
A few spreadsheet habits will save headaches: keep one row or column per day with no merged cells, never leave a day’s cell blank if the register has a value (blanks are ignored by AVERAGE, which silently changes your divisor), and freeze the header row so you can scroll long registers safely. Also remember that AVERAGE ignores text cells — so if a stray word like “holiday” sits in your range, filter those rows out first.
Common Mistakes That Skew the Result
Including holidays and closures. Days when school was not in session should never enter the divisor. Including them punishes the average for days nobody could have attended.
Treating blanks as zeros. A missing register entry means “no data,” not “nobody came.” Track down the actual figure before calculating.
Mixing headcount and rate versions. Reporting “average attendance of 28.25%” when you computed a headcount, or vice versa, confuses everyone who reads the report. Label the number clearly.
Averaging averages of different-sized groups. As Example 3 showed, a simple average of group averages is wrong unless the groups are equal in size. Always weight by group size.
Using different periods for comparison. Comparing one class’s monthly average with another’s term average is meaningless. Standardize the period first.
When an Average Can Mislead You
An average is a summary, and every summary discards information. A class with an average rate of 90% could consist of thirty students each attending 90% of days — or fifteen students at 100% and fifteen at 80%. The average is identical; the classroom reality is not.
Averages also mask trends. A term that began at 98% and slid to 82% averages 90%, the same as a term that held steady at 90% throughout. The first scenario signals a growing problem; the second signals stability. Plotting the weekly figures alongside the average reveals what the single number hides.
Researchers who study attendance patterns have long argued that averages alone are a weak diagnostic. Organizations like Attendance Works, for example, recommend tracking chronic absence — the share of students missing 10% or more of school days — because a school can have a decent average attendance rate while many individual students struggle. Their chronic absence research explains why counting struggling students matters more than admiring a single group number.
The practical takeaway: use the average attendance formula for what it is good at — a quick, comparable summary — and pair it with at least one distribution-aware measure whenever decisions about real students are on the line.
A Quick Checklist Before You Share the Number
Before the average attendance figure leaves your desk, run through this list:
- The period is defined and documented, with holidays and closures excluded.
- Every day in the period has a verified present count — no blanks treated as zeros.
- The formula version (headcount, rate, or weighted) is stated next to the result.
- The result is labeled with its unit: students per day, or percent.
- Combined groups were weighted by size, not simply averaged.
- Rounding was applied once, at the end.
- The figure has been sanity-checked against its ceiling (class size or 100%).
A number that passes this checklist can be defended in a staff meeting, a parent conference, or an inspection.
Frequently Asked Questions
What is the average attendance formula?
The average attendance formula is: (sum of students present each day) divided by (number of days). For the rate version, it is: (total attendances divided by total possible attendances) multiplied by 100. Both versions summarize attendance over a period into a single figure.
Can average attendance be more than 100%?
No. An average attendance rate can never exceed 100%, because total attendances can never exceed total possible attendances. A headcount average can never exceed the number of enrolled students. If your calculation breaks these ceilings, check your arithmetic or your data.
How is average attendance different from attendance percentage?
Attendance percentage usually describes one person or one class over one period. The average attendance formula aggregates many such values — across days, students, or months — into a single summary number. Think of percentages as the ingredients and the average as the blended result.
How many days of data do I need for a meaningful average?
There is no universal minimum, but a handful of days can be distorted by a single unusual event. A month or a full term gives a far more stable figure. Whatever period you choose, state it clearly so readers can judge the number in context.
Should I use a simple or weighted average for my school?
Use the weighted version whenever you combine groups of different sizes, such as sections, grades, or schools. Use the simple version when every unit being averaged represents the same number of students or days.
Does the formula work for employee attendance too?
Yes. Replace students with employees and school days with scheduled workdays, and the same formulas apply. HR teams often compute average daily attendance headcounts and absence rates with exactly these methods.


