 Skip to main content



Every HR team has felt it: the vague sense that “people are out a lot lately,” with no number attached. The absenteeism rate turns that feeling into a single, trackable percentage. It measures what share of scheduled work time was lost to unplanned absence over a given period — and once it is measured, it can be managed.
This guide explains how to calculate the absenteeism rate from scratch: the core formula, what counts in the numerator and what does not, how to adapt the math for individuals, teams, shifts, and hours, what the benchmarks look like, and the common mistakes that produce misleading numbers.
What the Absenteeism Rate Measures
The absenteeism rate answers one question: of all the work time that was scheduled, what percentage was lost to unplanned absence? It is expressed as a percentage so it can be compared across teams of different sizes, across months of different lengths, and against industry benchmarks.
It is important to understand what it does not measure. It does not measure approved vacation, parental leave, or public holidays — those are planned and scheduled. It measures unplanned absence: sick days, no-shows, and other unscheduled time away. Confusing the two produces a number that reflects the company’s leave policy rather than an attendance problem. Readers dealing with the policy side of absence types can review the difference between excused and unexcused absence before running the numbers.
The Core Absenteeism Rate Formula
The standard formula, recognized by ISO and used across HR practice, is:
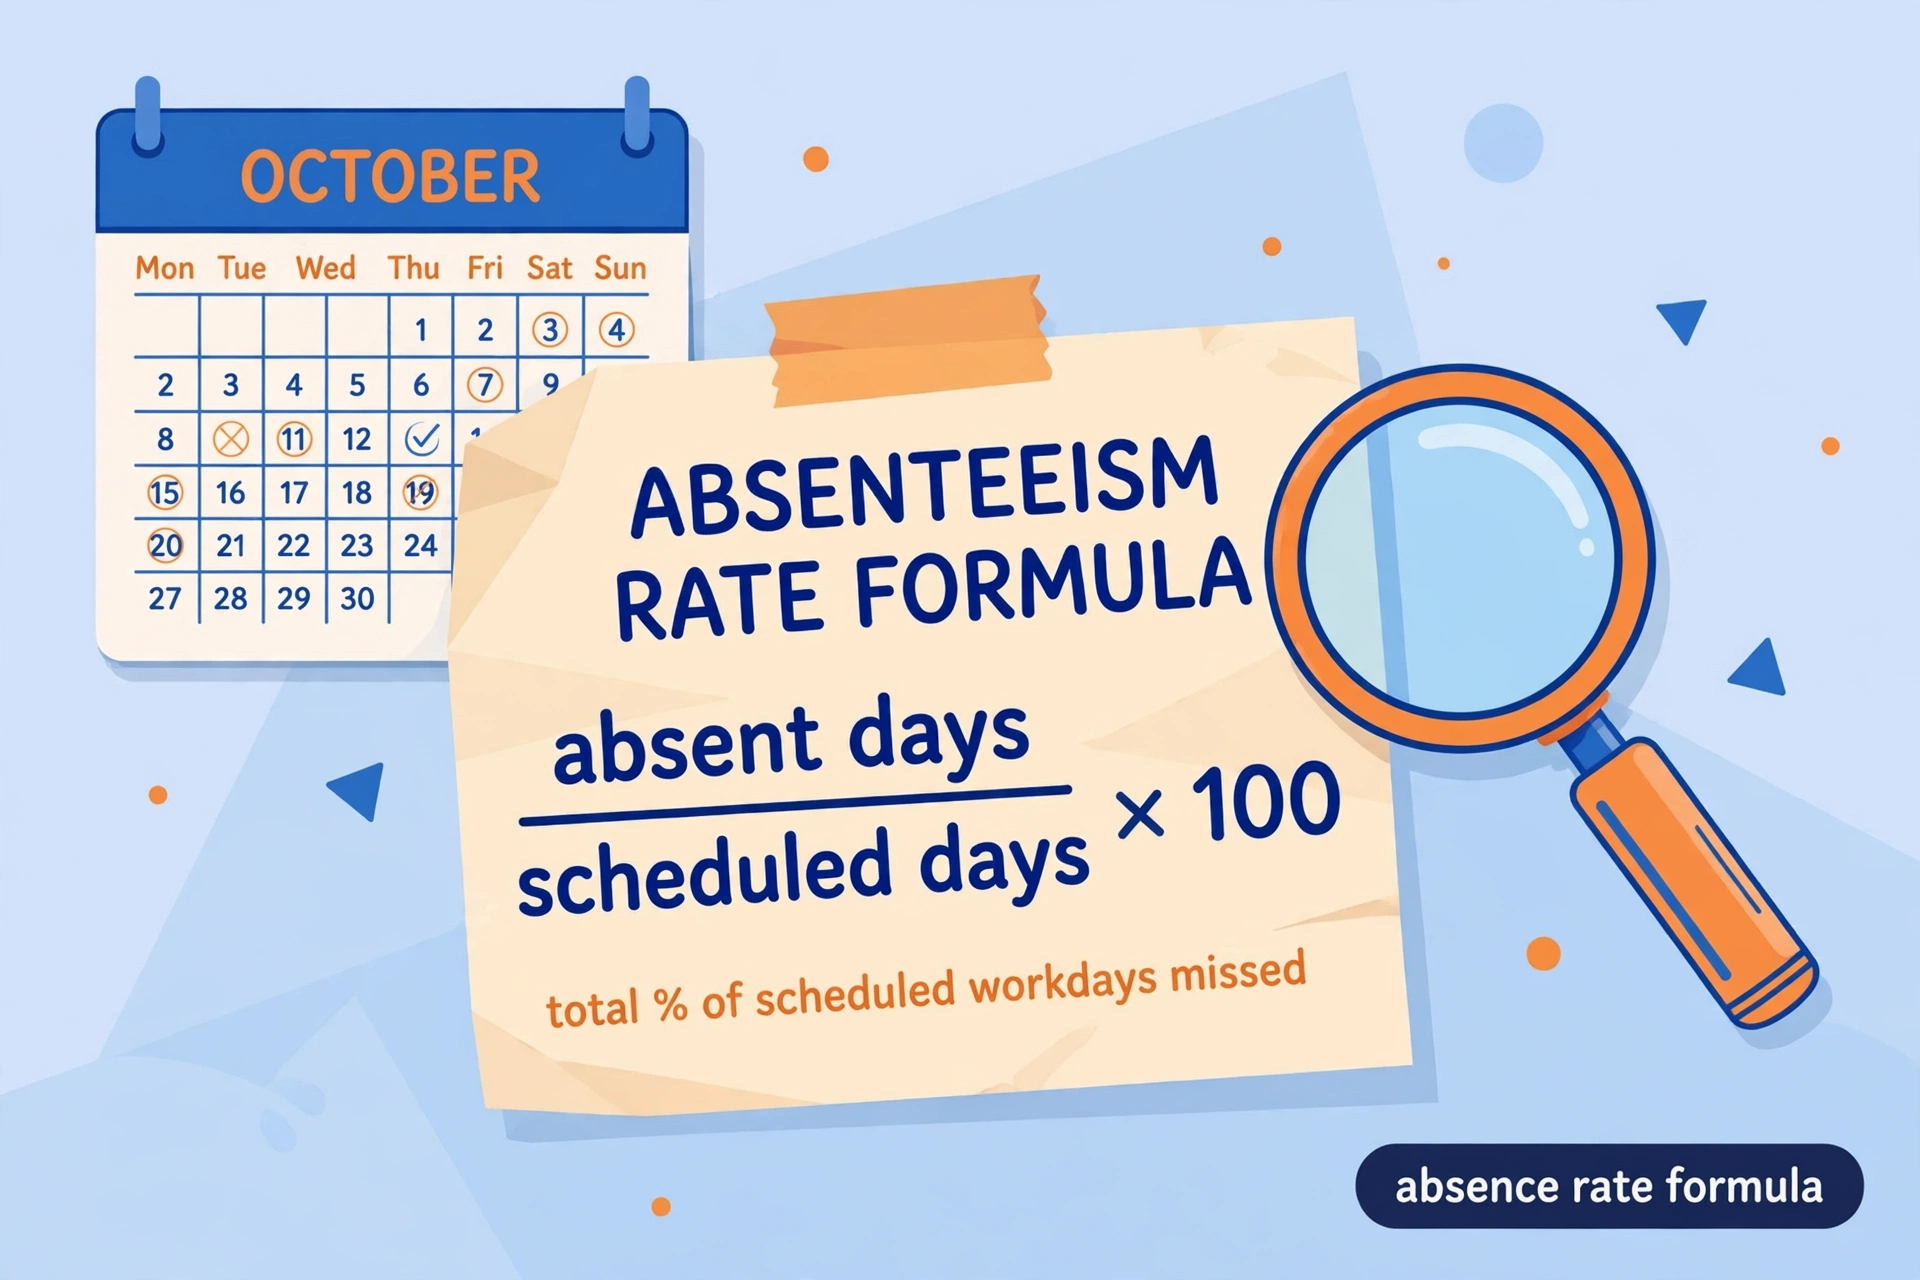
Absenteeism Rate = (Number of Absent Days ÷ Total Available Workdays) × 100
For a single employee over one month, the inputs are simple. For a team or company, both the numerator and denominator are summed across everyone: total absent days across the group divided by total scheduled workdays across the group, times 100.
A quick example: an employee is absent 4 days out of 20 scheduled workdays in a month. The rate is (4 ÷ 20) × 100 = 20%. That is a high number for one month — and precisely the kind of signal the metric exists to surface.
What Counts as “Absent” — and What Does Not
The numerator is where most calculation errors begin. Getting it right requires a clear rule, applied consistently:
Count in the numerator (unplanned absence): – Sick days, including partial-day sick leave converted to day or hour equivalents – No-shows and no-call absences – Unexcused absences of any kind
Exclude from the numerator (planned or non-work time): – Approved annual vacation and paid time off – Parental, maternity, and long-service leave – Public holidays and company shutdown days – Jury duty and other statutory leave
Exclude from the denominator too: public holidays, weekends (for Monday–Friday operations), and any days the business was closed. The denominator is available workdays — days the employee was actually expected to work. Including holidays in the denominator artificially dilutes the rate.
Legitimate sick leave deserves a note of care here. Employees are entitled to take sick leave they have accrued, and using it is not misconduct. The rate and the pattern are the signal — never an individual absence. The metric exists to spot trends, not to punish someone for catching the flu.
Step-by-Step: Calculating the Rate for One Employee
Follow these steps for an individual monthly rate:
- Define the period. One calendar month is the most common window for individual tracking.
- Count scheduled workdays. For a standard full-time employee in a typical month, this is usually 20–23 days. Exclude public holidays.
- Count unplanned absent days. Sum sick days and unexcused absences. Convert partial days consistently — two half-days equal one full day.
- Divide and multiply by 100. (Absent days ÷ scheduled days) × 100.
Example: an employee scheduled for 22 days takes 3 sick days. (3 ÷ 22) × 100 = 13.6%. One rough month, but a single data point — the trend over three to six months is what matters.
Step-by-Step: Calculating the Rate for a Team or Company
The team calculation uses the same formula with summed inputs:
- Sum every team member’s absent days for the period — the total numerator.
- Sum every team member’s scheduled workdays — the total denominator. For a team of 10 each scheduled 20 days, that is 200.
- Divide and multiply by 100.
Example: a 10-person team with 200 scheduled workdays and 12 total absent days has a rate of (12 ÷ 200) × 100 = 6%. That sits above most healthy benchmarks and warrants a closer look at which team members and which days are driving it.
For an annual organizational rate, the same logic scales up: total absent days across all employees for the year divided by total scheduled workdays across all employees for the year. An organization with 100 employees each scheduled 225 days (22,500 workdays) and 508 total absent days has an annual rate of (508 ÷ 22,500) × 100 = 2.26% — a healthy figure.
Days vs. Hours vs. Shifts: Picking the Right Unit
The formula adapts to how work is actually scheduled, and choosing the right unit makes the number more truthful:
- Days — the default for salaried, Monday–Friday workforces. Simple and comparable to national benchmarks.
- Hours — better for hourly and part-time teams, where a “day” varies in length. Absenteeism Rate = (Absent Hours ÷ Scheduled Hours) × 100. Partial-shift callouts that vanish in a day-based count show up properly here.
- Shifts — the natural unit for rostered operations like retail, hospitality, and healthcare. Absenteeism Rate = (Shifts Missed ÷ Total Scheduled Shifts) × 100. A team scheduled 400 shifts in a month with 18 missed unexpectedly has a 4.5% rate.
The rule is consistency: pick the unit that matches how the business schedules work, and use it every period so trends are comparable. Switching units mid-year breaks the trend line.
Benchmarks: What Counts as a Good Absenteeism Rate?
A number without context is just a number. Organizations like Attendance Works publish research on absence benchmarks and their real-world impact. The most cited reference points:
- Below 1.5% — excellent. The workforce is highly engaged and healthy.
- 1.5% to 3% — normal for most industries. This is where well-run organizations typically sit.
- 3% to 5% — room for improvement. Worth investigating which teams or seasons drive it.
- Above 5% — a significant problem, likely affecting operations and costs. The World Health Organization suggests healthy rates fall below 5%, and several national datasets cluster the average around 4–5%.
The US Bureau of Labor Statistics data provides useful grounding: the lost-worktime rate (hours absent as a share of hours usually worked) runs around 1.7% for full-time workers. Sector matters enormously — physically demanding industries like manufacturing, healthcare, and construction run higher than office-based ones — so the most meaningful comparison is against the organization’s own history and its direct industry peers, not a single national figure.
The trend matters more than any single reading. A rate that holds steady near the industry norm is healthy. A rate climbing quarter over quarter, or spiking in one team or season, is the signal to investigate.
Bonus Metric: The Bradford Factor
Teams that calculate the absenteeism rate often adopt a companion metric: the Bradford Factor, which measures the disruptiveness of absence patterns rather than just volume. The formula is:
Bradford Factor Score = S² × D
Where S is the number of separate absence spells in a rolling period (usually 52 weeks) and D is the total days absent in that period.
Why it matters: two employees can each miss 10 days a year, but one took a single 10-day medical leave while the other had ten separate one-day absences. The second pattern is far more disruptive to scheduling — and the Bradford Factor captures it. Ten spells of one day scores 10² × 10 = 1,000; one spell of ten days scores 1² × 10 = 10.
Typical employer thresholds run from no action below 50, through verbal and written warnings in the low hundreds, up to final warnings above 400 — though every organization sets its own trigger points in its attendance policy. The Bradford Factor complements the absenteeism rate: the rate shows how much time was lost, the factor shows how disruptively it was lost.
6 Mistakes That Skew the Absenteeism Rate
- Including approved leave in the numerator. Vacation and parental leave are planned; counting them measures the leave policy, not absenteeism.
- Including holidays in the denominator. Non-work days dilute the rate and make unhealthy absence look normal.
- Mixing units. Counting some absences in days and others in hours within the same calculation produces nonsense.
- Ignoring partial days. Two half-day absences equal one full day. Dropping them understates the rate, especially in hourly workforces.
- Comparing unlike periods. A 28-day February and a 31-day March have different denominators; compare rates, not raw absence counts, and prefer rolling averages for trend analysis.
- Acting on a single month. One bad month can reflect a flu wave, not a cultural problem. Three to six months of data reveals the real pattern.
From Number to Action: What to Do With the Rate
Calculating is the easy half. The value comes from what happens next:
- Track it monthly and visually. A simple line chart of the rate over 12 months reveals seasonality — winter illness spikes, post-holiday dips — that a table of numbers hides.
- Break it down. Company-wide rates hide problems. Slice by department, shift, and manager to find where absence concentrates. A single struggling team often drives an entire company’s elevated rate.
- Read the pattern, not just the volume. Monday/Friday clustering points at scheduling or morale; concentration after roster changes points at the change itself; rising absence alongside rising overtime usually means fatigue.
- Pair measurement with support. Organizations that bring the rate down sustainably usually combine clear attendance policies with flexible scheduling, wellness support, and workload review. The metric diagnoses; the response cures.
Teams that want structured tactics for the response side can work through 12 tactics to improve employee attendance, and managers pulling the underlying data from their systems may find a guide to pulling attendance reports from Zoom useful for remote and hybrid teams.
Frequently Asked Questions
What is the formula for absenteeism rate?
Absenteeism Rate = (Number of Absent Days ÷ Total Available Workdays) × 100. For hourly teams, use hours: (Absent Hours ÷ Scheduled Hours) × 100. For shift teams: (Shifts Missed ÷ Total Scheduled Shifts) × 100.
What is a good absenteeism rate?
Below 1.5% is excellent, 1.5–3% is normal for most industries, 3–5% suggests room for improvement, and above 5% indicates a significant problem. The most meaningful benchmark is the organization’s own trend and its industry peers.
Should vacation days be included in the absenteeism rate?
No. Approved vacation, parental leave, and public holidays are planned absences and must be excluded from both the numerator and (for holidays) the denominator. Only unplanned absence belongs in the calculation.
How is absenteeism rate different from the Bradford Factor?
The absenteeism rate measures how much scheduled time was lost to absence. The Bradford Factor (S² × D) measures how disruptive the pattern was, penalizing frequent short spells more heavily than single long ones.
How often should the absenteeism rate be calculated?
Monthly calculation with a rolling 3- or 12-month view is the standard rhythm. Monthly numbers catch spikes early; the rolling average shows the true trend without seasonal noise.
Can the absenteeism rate be calculated for remote teams?
Yes. The formula works the same way — scheduled workdays versus unplanned absent days. For remote teams, clear absence-reporting practices matter more, since “absence” is less visible than in an office.
What causes a high absenteeism rate?
Common drivers include illness waves, burnout and fatigue (often alongside heavy overtime), poor scheduling, low engagement, long commutes, and caregiving pressures. The pattern of absence usually points at the cause better than the total does.


