 Skip to main content


Most students know how to work out their attendance for a single class. They divide the number of lectures they attended by the number of lectures held and multiply by one hundred. It is simple, and it takes less than a minute. But at the end of a semester, schools, colleges, and scholarship committees rarely ask for that single-class number. They ask for one overall figure: a combined attendance percentage that covers every subject, lab, and practical on the timetable.
That is where many students get stuck. Merging five or six different subject percentages into one number is not as straightforward as it looks, and the most common shortcut, taking a simple average of the percentages, often produces a number that is quietly wrong. This guide explains how to calculate overall attendance percentage the right way. It compares the simple average method with the more accurate weighted average method, walks through fully worked examples with illustrative figures, and flags the mistakes that trip students up most often.
If you only need the basic calculation for one subject first, start with this step-by-step guide to calculating attendance percentage for a single subject.
What Is Overall Attendance Percentage?
Overall attendance percentage is a single number that represents a student’s presence across their entire timetable. Instead of looking at one subject, it pools every class the student was supposed to attend, including lectures, tutorials, labs, and practicals, and expresses how many of those they actually attended as a percentage.
The core idea is straightforward:
Overall attendance percentage = (total classes attended across all subjects / total classes held across all subjects) x 100
This number shows up in more places than students expect. It appears on report cards and semester transcripts, it feeds into the minimum-attendance rules many institutions enforce, such as the familiar 75 percent bar, and it is often requested on scholarship applications and internship forms. To understand why institutions care about this number so much, it helps to read about what attendance percentage means and why it matters before running the numbers.
Why Averaging Subject Percentages Usually Gives the Wrong Answer
Here is the trap most students fall into. Suppose a student has 80 percent attendance in mathematics and 100 percent in art. It feels natural to add 80 and 100, divide by two, and declare an overall attendance of 90 percent. That number is wrong, or at least, it is only right by coincidence.
The problem is that subjects do not meet equally often. Mathematics might have met forty times during the semester, while art met only ten times. The 80 percent in mathematics represents thirty-two attended classes out of forty, and the 100 percent in art represents ten out of ten. The true combined attendance percentage is forty-two attended classes out of fifty held, which works out to 84 percent, not 90.
This gap between the simple average and the true figure is exactly why learning how to calculate overall attendance percentage correctly matters. The simple average treats every subject as equally important, while the weighted approach respects how many classes each subject actually contributed to the timetable.
Method 1: The Simple Average Method
The simple average method adds up the individual subject percentages and divides by the number of subjects. It is quick, and there is exactly one situation where it is correct: when every subject had the same number of classes.
The steps are:
- Calculate the attendance percentage for each subject separately.
- Add all the subject percentages together.
- Divide the total by the number of subjects.
Here is an illustrative example. A student takes four subjects, and each subject held exactly twenty classes. Their subject percentages are 90, 80, 70, and 100. The simple average is (90 + 80 + 70 + 100) / 4 = 85 percent. Because every subject had the same twenty classes, this answer is correct.
The moment class counts differ between subjects, this method starts drifting from the truth. On a timetable where one subject meets five times a week and another meets once, the drift can be several percentage points, which is easily enough to push a student above or below an eligibility cutoff.
How to Calculate Overall Attendance Percentage With the Weighted Average Method
The weighted average method is the correct general approach for combined attendance percentage, and it is the method most institutions expect. Instead of averaging percentages, it goes back to the raw class counts. It adds up every class attended in every subject, adds up every class held in every subject, and then converts that single ratio into a percentage.
Weighted overall attendance = (sum of classes attended in all subjects / sum of classes held in all subjects) x 100
Because subjects with more classes contribute more to both totals, the result automatically gives each subject its fair weight. A subject that met forty times influences the final number four times as much as one that met ten times, which is exactly as it should be. This weighted average attendance figure is the one that appears on official records.
Worked Example: Five Subjects in One Semester
Consider the following illustrative example of one student’s semester attendance across subjects:
| Subject | Classes held | Classes attended | Subject percentage |
|---|---|---|---|
| Mathematics | 40 | 34 | 85% |
| Physics | 36 | 30 | 83.3% |
| Chemistry | 36 | 36 | 100% |
| English | 24 | 18 | 75% |
| Computer lab | 20 | 16 | 80% |
Step 1: total classes held = 40 + 36 + 36 + 24 + 20 = 156.
Step 2: total classes attended = 34 + 30 + 36 + 18 + 16 = 134.
Step 3: overall attendance = (134 / 156) x 100 = 85.9 percent.
Now compare that with the simple average of the five subject percentages: (85 + 83.3 + 100 + 75 + 80) / 5 = 84.7 percent. The two methods differ by more than a full percentage point. In this example the simple average understates the student’s attendance, but on other timetables it can overstate it, which is the dangerous direction when a cutoff is involved.
Schools and education agencies track attendance patterns closely at a national level. The National Center for Education Statistics publishes federal education data showing how attendance trends vary across grade levels and student groups, which is one reason institutions take the combined figure so seriously.
How to Calculate Overall Attendance Percentage Across Semesters
Students often need one attendance figure that spans more than one semester, for a full academic year or an entire degree program. The rule here is the same as for combining subjects: do not average the semester percentages. Pool the raw numbers instead.
- Add up the classes attended in every semester you want to include.
- Add up the classes held across those same semesters.
- Divide the first total by the second and multiply by one hundred.
Here is an illustrative example using two semesters. In semester one, a student attended 260 of 300 classes, which is 86.7 percent. In semester two, the same student attended 240 of 290 classes, which is 82.8 percent. Averaging the two semester attendance percentages gives 84.75 percent. The correct cumulative figure is (260 + 240) / (300 + 290) x 100 = (500 / 590) x 100 = 84.7 percent.
The difference looks tiny here because the two semesters are similar in size. But when one semester is much shorter than the other, or includes a heavy lab schedule, the simple average can mislead badly. This same principle extends to any longer period: always combine the raw attended and held counts first, and convert to a percentage only at the very end.
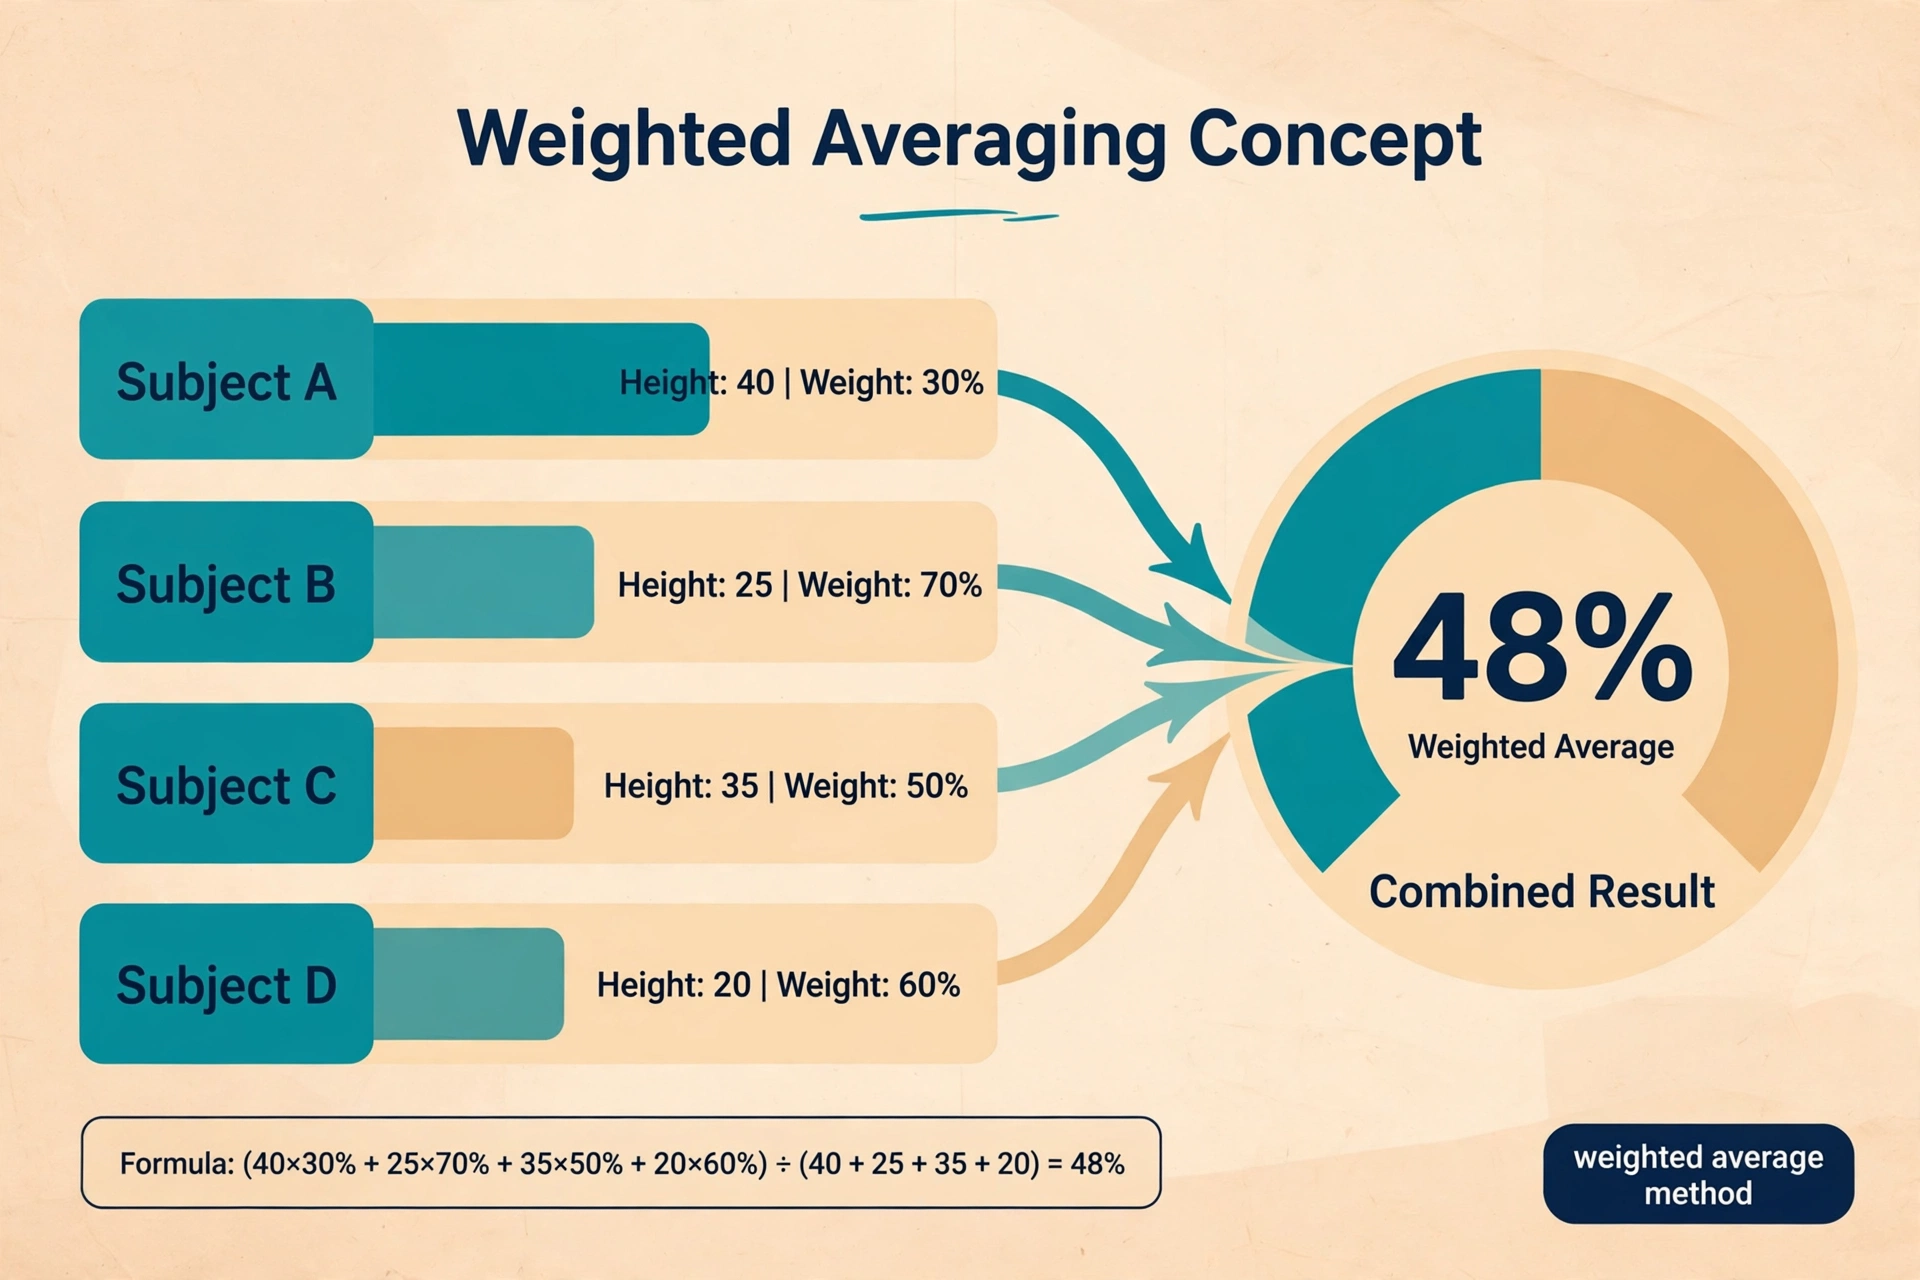
Simple Average vs Weighted Average: Which Method Should You Use?
| Situation | Simple average | Weighted average |
|---|---|---|
| Every subject held the same number of classes | Works, both methods agree | Works, always safe |
| Subjects met different numbers of times | Gives the wrong answer | Correct method |
| Combining semesters of different lengths | Gives the wrong answer | Correct method |
| Institution specifies its own formula | Follow the institution’s rule | Follow the institution’s rule |
The practical takeaway is simple. The weighted method is never wrong, while the simple average is only right in the special case of equal class counts. When in doubt, weight by class counts and you will always land on the true overall attendance.
6 Common Mistakes Students Make When Combining Attendance
1. Averaging percentages from subjects with unequal class counts. This is the number one error, and it was covered in detail above. Percentages hide the class counts behind them, so always unpack them into attended and held numbers before combining.
2. Leaving out labs, practicals, and tutorials. Many students compute their overall attendance from theory lectures alone. If labs count toward the official total at their institution, omitting them skews the result, usually downward, since lab attendance tends to run lower than lecture attendance.
3. Rounding too early. Rounding each subject’s percentage before combining introduces small errors that add up across five or six subjects. Keep at least one decimal place through every intermediate step and round only the final answer.
4. Mixing semesters or academic years. Combining this semester’s attended classes with last year’s held classes produces a meaningless number. Keep each calculation period cleanly separated, then pool periods deliberately using the semester method shown above.
5. Guessing the total classes held. Some students estimate about thirty classes per subject instead of checking the actual timetable or attendance register. The total held is half of the formula, so a wrong total guarantees a wrong percentage. Get the real figure from the timetable or the class coordinator.
6. Ignoring the institution’s own rule. A few schools and universities define overall attendance their own way, for example by weighting certain papers differently or excluding specific activity periods. The weighted method matches most official definitions, but the institution’s handbook is the final authority.
Quick Formula Recap
Simple average, for equal class counts only:
(Subject 1% + Subject 2% + … + Subject N%) / N
Weighted average, correct in every case:
(Total attended across all subjects / Total held across all subjects) x 100
Across semesters:
(Total attended across all semesters / Total held across all semesters) x 100
What to Do After Calculating Your Overall Attendance
A number is only useful if it leads to action. Once the overall attendance is calculated, the smart move is to look at which subjects are dragging it down. A single subject with very low attendance hurts the weighted total far more than a small dip spread across many subjects, so improvement efforts should start with the weakest subject that also has the most classes remaining.
Students who find themselves below their institution’s cutoff should track their attendance weekly instead of discovering the shortfall at semester’s end, keep documentation for any medical or emergency absences, and speak with a class mentor or coordinator early. Most institutions would rather help a student recover than fail them on a technicality.
To skip the manual arithmetic, run the numbers through the free attendance calculator and keep a running total as the semester progresses.
Frequently Asked Questions
Can I just average my subject-wise attendance percentages to get my overall attendance?
Only if every subject had exactly the same number of classes. Otherwise, average the raw class counts instead: add up all classes attended, add up all classes held, and convert that ratio to a percentage. This weighted approach is the correct method in every case.
How do I calculate overall attendance percentage if I do not know the total number of classes held?
Check the timetable for the number of sessions per week per subject and multiply by the number of teaching weeks, or ask the class coordinator for the official count. Estimating the total is the most common source of error, so it is worth getting the real figure.
Do labs and practicals count toward overall attendance?
In most institutions, yes. Any scheduled session where attendance is recorded counts toward the total. The safest approach is to include every session the institution records, and to confirm with the official attendance policy if anything is unclear.
What is a good overall attendance percentage?
Many institutions set the minimum bar at 75 percent, and falling below it can mean losing exam eligibility. Anything comfortably above the local cutoff, typically in the 85 to 95 percent range, is considered strong, but the exact threshold varies by institution.
How is overall attendance different from subject-wise attendance?
Subject-wise attendance describes one class in isolation, while overall attendance combines every subject into a single figure. A student can have excellent attendance in most subjects and still fall short overall if one heavy subject pulls the weighted total down.
How often should I recalculate my overall attendance?
Once a month is a good rhythm during the semester, and weekly once attendance starts approaching the cutoff. Regular checks turn the final number into a running total the student controls, instead of a surprise at the end of term.


