 Skip to main content


Ask people to eat a quarter less for two years and most will predict failure. That was, in essence, the assignment handed to participants in the CALERIE 2 trial, one of the longest and most careful calorie-restriction studies ever run in healthy adults. A new analysis of what those participants actually ate, reported this week, tells a more encouraging story than the target suggests: the group did not hit the 25 per cent reduction they were asked for, and yet their diets got better on every measure the researchers used. The benefit, it turns out, may have come less from the size of the cut than from what replaced the missing calories.
The analysis looked at detailed food records from 218 healthy adults without obesity, split between a calorie-restriction group and a group that continued eating normally. The restriction group received extensive nutrition education alongside their target, and their eating was tracked at the start of the trial and again at six, twelve, eighteen and twenty-four months. Two full years of records is rare in nutrition research, where most studies rely on memory and short snapshots, and it is what gives this analysis its weight. The findings were reported by Yahoo Health, drawing on MindBodyGreen’s coverage of the study, on October 30, 2026.
The plan: cut a quarter of daily calories
The CALERIE 2 design was deliberately ambitious. Participants in the restriction group were asked to reduce their calorie intake by 25 per cent and keep that reduction going for two years, with nutrition education to help them do it. A quarter is a large cut: for someone eating 2,000 calories a day, it means finding a way to live, permanently, on 1,500. The trial was designed to test whether such a reduction could slow aspects of biological aging, and earlier analyses of CALERIE data have indeed linked calorie restriction to lower age-related inflammation.
But a target is not an outcome. Trials measure what people actually do, and the gap between the two is where most diets live or die. This analysis closes that gap by examining the food records themselves rather than the prescription, and the gap turned out to be large: the restriction group achieved an average reduction of about 12 per cent, roughly half the target. By the usual standard of diet trials, that would read as a shortfall. The surprise is that it did not behave like one.
The plan vs what actually happened
| What was asked | What actually happened |
|---|---|
| 25% calorie reduction | About 12% average reduction |
| Two years of restriction | Food records at baseline, 6, 12, 18 and 24 months |
| Nutrition education alongside | Extensive education delivered to the restriction group |
| Diet quality as a side question | Diet quality improved on every measure used |
| Healthy Eating Index | Higher scores in the restriction group |
| Inflammatory load of the diet | Lower, with a shift toward whole foods |
The table reframes the trial. Judged against its own target, the intervention under-delivered. Judged against its participants’ plates, it transformed them. The group eating less also ate better, and the researchers’ reading is that the improvement in what they ate may matter at least as much as the reduction in how much.
How the eating was actually measured
A study like this stands or falls on how honestly it captures what people eat, and the CALERIE researchers chose the most labour-intensive option available: detailed food records collected at five points across the two years. Participants logged what they ate in full, and those records were reviewed alongside the nutrition education they received. That matters because most nutrition headlines rest on far weaker evidence, often a single questionnaire asking people to remember months of eating. A single snapshot can be distorted by a good week or a bad one; five snapshots across two years show a pattern, including whether changes made in the first months survived into the second year.
The records were then scored in two complementary ways. The Healthy Eating Index measures how closely a diet matches established dietary guidance, rewarding the foods guidance emphasises and marking down the ones it warns against. Alongside it, the researchers assessed how inflammatory the overall diet was, a measure that captures whether the foods someone eats tend to promote or calm low-grade inflammation in the body. Both scores moved in the same direction for the restriction group, which is reassuring: when two different lenses show the same improvement, the finding is less likely to be an artefact of one scoring system. It is this measurement quality, more than any single headline figure, that makes the analysis worth taking seriously.
Five shifts that showed up on the plate
The food records show a consistent pattern rather than a single change. Five shifts, taken together, describe a diet that moved toward nutrient density as calories came down.
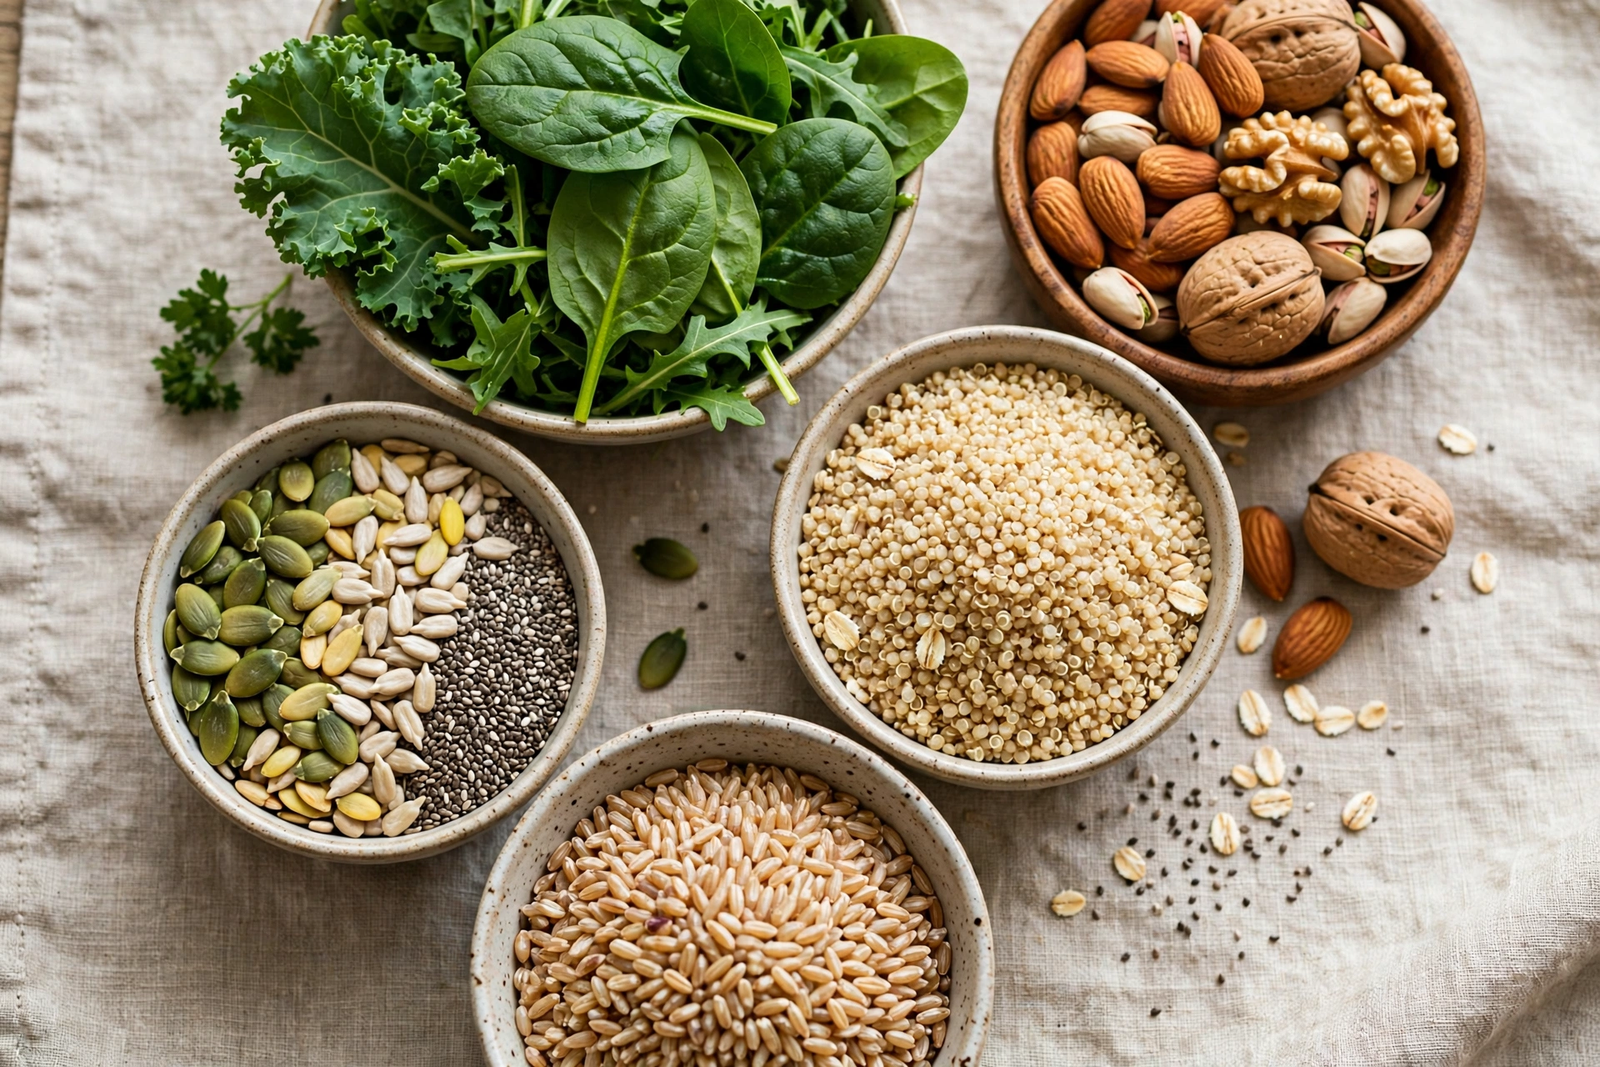
First, whole foods displaced processed ones. Participants ate more foods in their natural or near-natural state and fewer heavily processed items, a shift that echoes other recent research linking ultra-processed eating to poorer health outcomes. Second, vegetables and legumes took a larger share of the plate, adding fibre, micronutrients and volume without adding many calories, which is one reason a smaller portion can still feel like a meal. Third, whole grains replaced refined grains more often, keeping the carbohydrate portion of the diet but changing its quality. Fourth, nuts and seeds appeared more regularly, bringing healthy fats and minerals in small, calorie-dense amounts that reward careful portioning. Fifth, healthy fats such as olive oil became a staple rather than an afterthought, rounding out a pattern that looks, in broad outline, like the Mediterranean-style eating pattern that nutrition researchers have studied for decades.
None of these shifts required exotic ingredients or a new cuisine. They are ordinary foods, rearranged. That ordinariness is part of the point: the diet that improved was built from a supermarket shop, not a supplement shelf.
Why a smaller cut still moved the needle

There are two plausible explanations for why a 12 per cent reduction delivered results the researchers had hoped a 25 per cent cut would bring, and they are not mutually exclusive. The first is that diet quality does real work on its own. A diet richer in whole foods and lower in inflammatory foods changes nutrient intake, gut signalling and metabolic markers even before weight changes much, and the Healthy Eating Index gains in this trial are consistent with that story. The original Yahoo Health report, drawing on MindBodyGreen’s coverage of the study, presents the researchers’ reading in full.
The second explanation is about sustainability. A 25 per cent cut is hard to maintain for two years, and a target people abandon helps nobody. A 12 per cent cut, supported by education and built around better food rather than simply less food, is something participants actually sustained for the full two years. The researchers’ takeaway, as reported, is that the benefit was driven mainly by improved food quality and nutrient density rather than by the size of the calorie cut itself. That reframes calorie restriction from a test of willpower into a design problem: make the smaller cut satisfying, and the body does the rest.
A supporting thread strengthens the reading. An earlier CALERIE analysis covering restriction of 10 to 30 per cent over six months to one year found a similar pattern, suggesting the diet-quality effect is not a quirk of this one dataset. Consistency across analyses, timeframes and research teams is what turns an interesting result into a credible one.
What stayed safe: adequacy without new gaps
One of the oldest worries about eating less is that it means getting less of everything, including nutrients the body needs. This analysis answers that worry directly: nutritional adequacy was maintained in the restriction group, and no new deficiencies emerged over the two years. That finding matters because it separates a supported, educated calorie reduction from an unguided one. The participants were not simply told to eat less and left alone; they received extensive nutrition education, and their records were reviewed across two years. Adequacy was an outcome of that support, not an accident.
It also sets a boundary on what the study endorses. The trial supports moderate, supported calorie reduction with attention to food quality. It does not support extreme restriction, unsupervised fasting, or cutting calories without regard to nutrient intake. The difference between those two things is the difference between this study’s message and a crash diet.
What this study does not prove
As with any single analysis, the limits deserve equal billing. The participants were healthy adults without obesity, so the findings do not automatically extend to people with obesity, diabetes or other conditions, where calorie needs and risks differ. Diet was measured through food records, which depend on honest and accurate reporting, and even detailed records have error in them. The analysis is observational in the sense that it describes what participants ate and how their diet scores changed; it does not by itself prove that the diet changes caused any particular aging outcome, and the researchers continue to study the longer-term health effects. Finally, two years is long for a nutrition trial but short against a lifetime of eating, and whether the improved pattern persists after the trial’s structure falls away remains to be seen.
Those limits do not cancel the result. They define its proper use: as evidence that a moderate, well-supported calorie reduction can improve diet quality and be sustained, not as proof that eating less guarantees a longer life.
Questions readers are asking
What is the CALERIE trial?
CALERIE is a long-running research programme that tested whether calorie restriction can slow biological aging in healthy adults. The second phase, CALERIE 2, enrolled 218 healthy adults without obesity and followed them for two years, with one group asked to cut calories by 25 per cent and a comparison group eating normally.
How much did participants actually cut?
On average, about 12 per cent, roughly half the 25 per cent target. The gap between target and reality is itself one of the study’s most useful findings, because the benefits appeared even at the smaller, achieved level.
What does a higher Healthy Eating Index score mean?
The Healthy Eating Index scores how closely a diet matches established dietary guidance, rewarding vegetables, whole grains, lean proteins and healthy fats and penalising excess added sugars, sodium and refined grains. A higher score means a diet that looks more like the pattern nutrition authorities recommend.
Did participants become deficient in nutrients?
No. The analysis found nutritional adequacy was maintained and no new deficiencies emerged over the two years, a result the researchers link to the nutrition education and support participants received alongside the calorie target.
Should I cut my calories by 12 per cent?
This study describes what happened in a supervised trial, not a prescription for any individual. Calorie needs vary with age, size, activity and health, and any sustained change to intake is worth discussing with a clinician or dietitian, especially for people with medical conditions, who are pregnant, or who are underweight.
A steadier way to think about eating less
The lasting image from this analysis is not a number but a plate: smaller, yes, but fuller of colour, fibre and variety than before. That is a gentler story than the usual narrative of restriction, and it may be a more useful one. People do not fail at eating less because they lack information about calories; they fail because the smaller amount feels like a loss. A pattern built around whole foods, vegetables, legumes, whole grains, nuts, seeds and healthy fats turns the smaller amount into a different kind of meal rather than a diminished version of the old one.
For anyone curious about their own numbers, a total daily energy expenditure estimate is the practical starting point, and the TDEE calculator provides it from age, height, weight and activity level. The background reading helps too: what TDEE actually measures explains the concept, and the guide to calculating TDEE step by step shows the arithmetic. And for a reminder of why food quality belongs in the same conversation as calories, the recent study linking heavy ultra-processed eating to silent brain changes, covered in this earlier article, makes the same point from the opposite direction. The full report on the CALERIE analysis is available through the original Yahoo Health article linked in the middle of this piece.


