
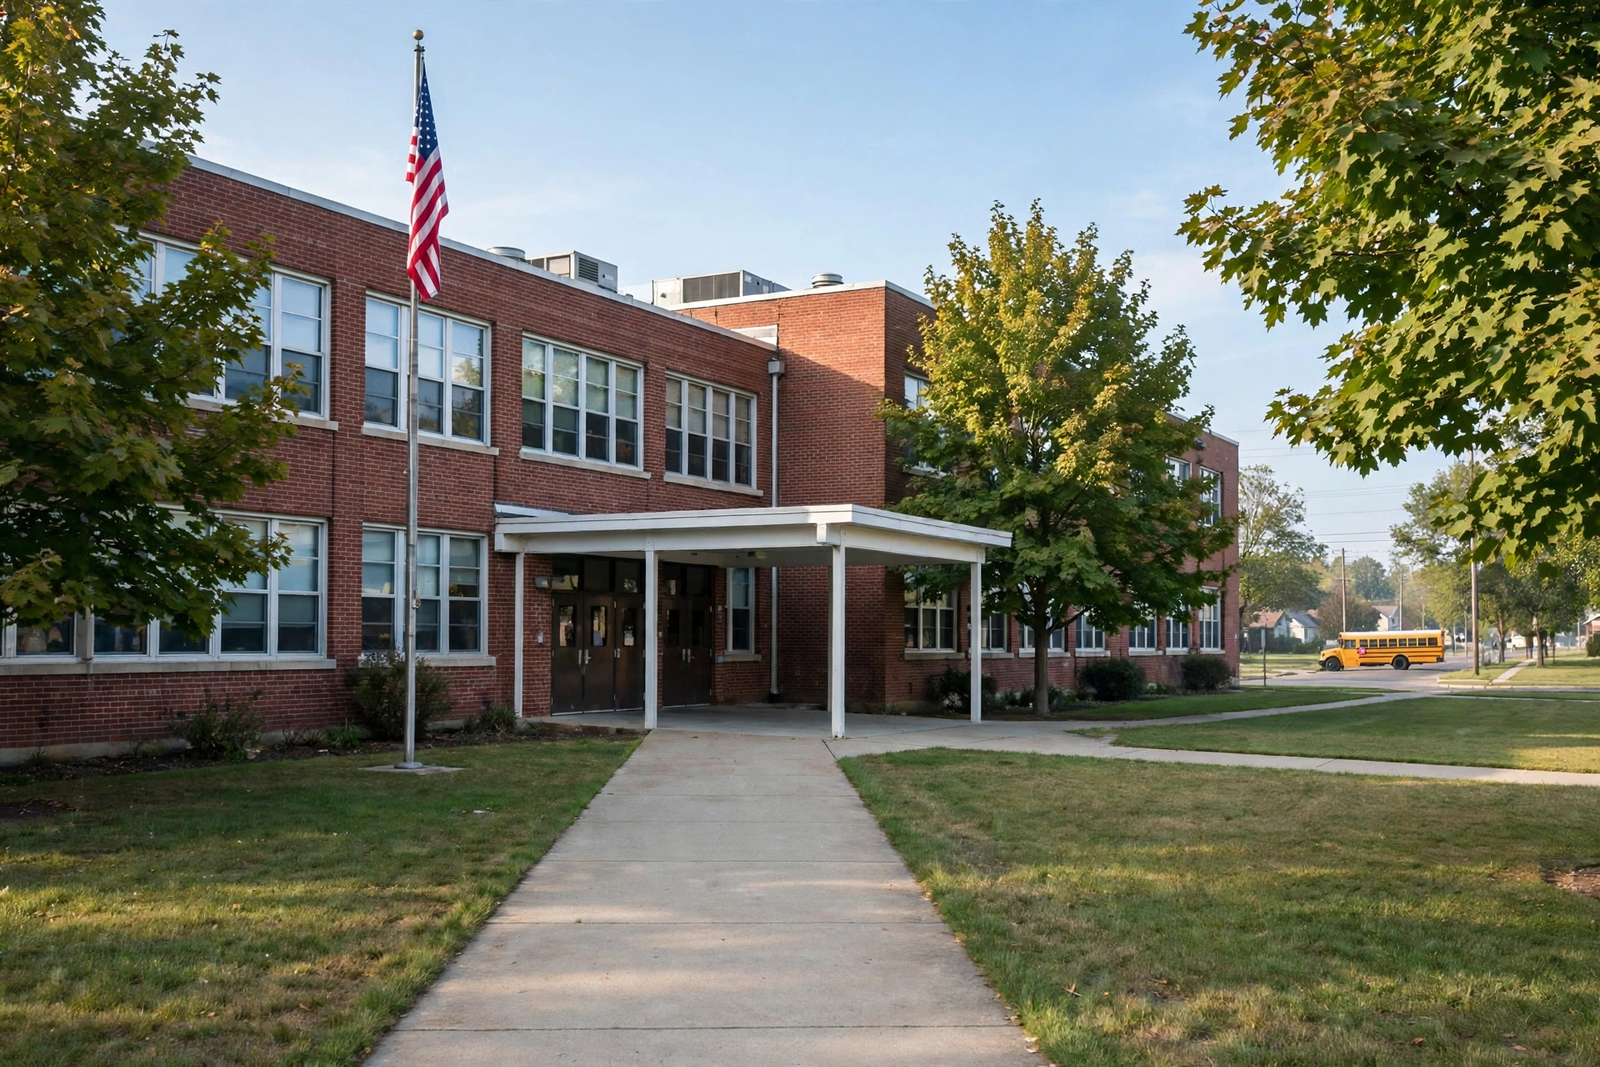
For the first time since the pandemic turned school attendance upside down, the national picture is improving almost everywhere it is measured. Fresh data compiled by FutureEd, updated on November 10, 2026, shows that chronic absenteeism improved in 25 of the 26 states that have reported figures for the 2025-26 school year. Only one state was unchanged. Not one got worse.
That is a striking result for a problem that has resisted easy fixes. Chronic absenteeism, defined as missing ten percent or more of the school year, surged after pandemic school closures and stayed high long after classrooms reopened. At its worst, more than one in four American students was chronically absent. The new numbers do not erase that damage. But they show a recovery that is now broad, steady, and in several states accelerating.
The tracker behind the figures is worth understanding first. FutureEd, a research group at Georgetown University, monitors each state’s own attendance data releases and compiles them into a single national picture, because there is no single federal dataset that does this job quickly. The tracker now runs from the last pre-pandemic school year, 2018-19, through 2021-22, 2022-23, 2023-24, 2024-25, and now 2025-26. This update adds five more states to the 21 that had reported earlier in the year, and the story it tells is the same one, only stronger.
The Headline Numbers
The figures below come from the FutureEd tracker update of November 10, 2026, and they describe the 2025-26 school year. Readers who want the full state-by-state picture can see the tracker itself, which is updated as each new state release arrives.
| State | 2018-19 | 2021-22 | 2022-23 | 2023-24 | 2024-25 | 2025-26 |
|---|---|---|---|---|---|---|
| National | 15% | 28% | 28% | 23% | 22% | N/A |
| Alabama | 17% | 26% | 23% | 21% | 19% | 17% |
| Alaska | 27% | 50% | 43% | 34% | 31% | 29% |
| Arizona | 14% | 32% | 32% | 31% | 29% | 28% |
| Arkansas | 12% | 25% | 23% | 21% | 20% | 19% |
| California | 12% | 30% | 25% | 20% | 19% | 18% |
| Connecticut | 11% | 24% | 20% | 18% | 16% | 15% |
| Delaware | 16% | 32% | 28% | 26% | 23% | 20% |
| District of Columbia | 29% | 48% | 43% | 39% | 36% | 33% |
| Florida | 14% | 31% | 28% | 24% | 22% | 21% |
| Georgia | 13% | 23% | 22% | 20% | 19% | 18% |
| Hawaii | 18% | 27% | 27% | 22% | 20% | 20% |
| Idaho | 15% | 30% | 27% | 24% | 22% | 20% |
| Illinois | 18% | 30% | 28% | 24% | 23% | 22% |
| Indiana | 11% | 21% | 19% | 18% | 17% | 16% |
| Iowa | 13% | 25% | 21% | 20% | 19% | 17% |
| Kansas | 13% | 25% | 24% | 21% | 20% | 18% |
| Kentucky | 15% | 30% | 29% | 26% | 24% | 23% |
| Louisiana | 15% | 31% | 27% | 24% | 23% | 21% |
| Maine | 14% | 26% | 23% | 20% | 19% | 17% |
| Minnesota | 12% | 30% | 28% | 25% | 23% | 21% |
| Mississippi | 14% | 29% | 25% | 23% | 21% | 19% |
| New Hampshire | 10% | 24% | 22% | 19% | 18% | 17% |
| Ohio | 17% | 30% | 28% | 25% | 24% | 23% |
| Rhode Island | 19% | 34% | 29% | 24% | 20% | 18% |
| South Carolina | 12% | 24% | 23% | 21% | 20% | 19% |
| Vermont | 17% | 34% | 29% | 26% | 24% | 24% |
Two things stand out in that table. First, the direction is nearly universal: 25 of the 26 states improved, and the one that did not, Vermont, was flat at 24 percent. Second, the scale of the improvement varies enormously. Alaska, the District of Columbia and Rhode Island have come down by double digits from their pandemic peaks, while Hawaii has barely moved, falling just seven points from its peak of 27 percent to 20 percent.
The six states that have fallen ten or more points below their peak deserve a closer look. Rhode Island is the standout, down 16 points from its peak of 34 percent in 2021-22 to 18 percent today, the lowest rate in the country relative to its starting point. Alaska has fallen 21 points from 50 percent, the highest rate anywhere, to 29 percent. The District of Columbia is down 15 points, from 48 to 33 percent. Connecticut is down nine points from its peak, and Delaware is down 12 points from 32 percent to 20 percent. South Carolina, down five points, has returned to within seven points of its pre-pandemic level.
A Seven-Year Timeline
To judge these numbers fairly, it helps to see the whole arc. Chronic absenteeism did not spike and fall in a single year. It moved through distinct phases, and each phase tells us something about what is working now.
2018-19: the baseline. Before the pandemic, about 15 percent of students were chronically absent. That was already a serious problem, but it was a stable one. Schools knew roughly what to expect, and the figure moved slowly from year to year.
2021-22: the peak. After school closures and a year of disruption, chronic absenteeism nearly doubled, reaching 28 percent nationally. In some states it passed 40 percent. Alaska hit 50 percent, and the District of Columbia reached 48 percent. The system was, in effect, trying to bring back students it had lost contact with.
2022-23 and 2023-24: the slow climb back. Rates began to fall, but slowly, and the recovery was uneven. Some states made real progress. Others stalled. The national rate eased to 23 percent by 2023-24, but the damage was still visible everywhere. Federal data for 2023-24 showed that nearly half of homeless students, 47.7 percent, were chronically absent.
2024-25: the turn becomes visible. The national rate fell to 22 percent. Early state reporting suggested the improvement was continuing, and the first round of 2025-26 data, covering 21 states, showed gains in every single one.
2025-26: the broadest improvement yet. With 26 states now reporting, 25 have improved and one is unchanged. No state has gone backwards. The recovery has not reached the pre-pandemic baseline anywhere except in Rhode Island, which is the only state within one percentage point of where it stood before the pandemic. But the direction is now unmistakable, and it is pointing the same way in almost every state at once.
That timeline is the real story. A single good year can be a statistical quirk. Four consecutive years of improvement, spreading to more states each time, is a trend.
What the Research Points To
The numbers raise an obvious question: what is actually driving the improvement? The research does not give a single answer, but it does point to a set of practices that keep showing up in the places that improve fastest.
The most consistent finding is that schools do better when they treat attendance as a relationship problem rather than a compliance problem. The Attendance Works research group has argued for years that families respond to early, personal contact: a phone call, a home visit, a conversation about what is getting in the way, rather than a letter threatening consequences. When schools reach out early, while an absence pattern is still small, they can solve problems before they harden into habits.
A second strand of research concerns what happens inside the classroom. Students come to school when school feels worth coming to. That sounds obvious, but it has real implications: engaging teaching, strong relationships with teachers, and a sense that the day will be interesting are all linked to better attendance. The pandemic damaged those connections, and rebuilding them takes time.
A third factor is practical support. Transport problems, health issues, housing instability and caring responsibilities all push attendance down, and they fall hardest on the families with the fewest resources. Schools that connect families with support, whether that is a bus pass, a health referral, or help with housing, tend to see attendance rise. The data on homeless students is a reminder of how steep that hill is: their chronic absence rate is more than double the national figure.
None of this is new. What is new is the scale at which schools are trying it. The broad improvement across 25 states suggests that these practices are spreading, and that the recovery is not just a bounce back from an extreme year, but a real change in how schools approach the problem.
Readers who want to understand the definitions behind the numbers can see what chronic absenteeism means, and those who want to work out what a particular pattern of absence adds up to can use the school attendance calculator to see how quickly missed days accumulate into a percentage.
The Gap That Remains
The improvement is real, but so is the gap. Even in the states that have improved most, chronic absenteeism is still well above its pre-pandemic level. The national rate was 15 percent before the pandemic. The latest figures put it around 22 percent. That is a recovery, not a return.
The gap is not spread evenly. The same federal data that showed the national improvement also showed that students from low-income families, students with disabilities, and students experiencing homelessness are still absent at far higher rates than their peers. Closing that gap will take more than the general recovery. It will take targeted work with the families who face the hardest barriers.
There is also a measurement gap. The FutureEd tracker depends on states publishing their data, and the pace at which they do so varies. Some states release figures quickly. Others lag by months. The national picture is therefore always a little out of date, and it is built from states that report, not from every state. The 24 states that have not yet reported for 2025-26 may tell a different story when their numbers arrive.
None of this should take away from the progress. Four years of steady improvement, now spread across almost every reporting state, is the best news American schools have had on attendance since the pandemic began. The question now is whether the recovery can continue until the gap is closed.
What Families Can Do
Families do not have to wait for a policy change to make a difference. The most useful thing a parent can do is the simplest: keep track of the numbers. A child who misses two days a month is on course to be chronically absent by the end of the year, even if no single absence feels serious at the time.
That is why it helps to have a clear picture of where things stand. Parents can use the school attendance calculator to work out the percentage from days attended and total days, and they can read how to track attendance for a simple routine that takes a few minutes a month.
The second useful step is to talk to the school early. If a child is starting to miss days, a conversation with a teacher or attendance officer can uncover the reason before it becomes a pattern. Schools have more help available than most families realise, but they can only offer it if they know there is a problem.
And the third is to make attendance a normal part of family life, like bedtime or homework. Children who understand why school matters, and who know their family expects them to be there, attend more regularly. It sounds simple, and it is. But simple things, done consistently, are what move numbers like these.

Frequently Asked Questions
What is chronic absenteeism?
Chronic absenteeism means missing ten percent or more of the school year, for any reason, excused or unexcused. In a 180-day school year, that is 18 days. A student can be chronically absent without ever being truant.
How many states improved in 2025-26?
Chronic absenteeism improved in 25 of the 26 states that have reported figures for the 2025-26 school year. One state, Vermont, was unchanged at 24 percent. No state got worse.
Which states have improved the most since the pandemic peak?
Alaska has fallen 21 points from its peak of 50 percent to 29 percent. Rhode Island is down 16 points, from 34 percent to 18 percent. The District of Columbia is down 15 points, from 48 to 33 percent. Delaware is down 12 points, from 32 percent to 20 percent.
Is chronic absenteeism back to pre-pandemic levels?
No. The national rate was about 15 percent before the pandemic and is around 22 percent now. No state has returned to its pre-pandemic level, although Rhode Island is within one percentage point of where it stood in 2018-19.
Where does the data come from?
The figures come from the FutureEd tracker at Georgetown University, updated on November 10, 2026. FutureEd compiles each state’s own attendance data releases into a single national picture, because there is no single federal dataset that does this job quickly.
What Happens Next
The next update will come when more states publish their figures. Twenty-four states have yet to report for 2025-26, and their numbers will complete the picture. If they follow the same pattern, the national story will be one of broad, continued improvement.
The harder question is whether the improvement can be sustained. The easy gains, the students who came back quickly once schools reopened, have mostly been made. The remaining gap is concentrated among students facing the toughest barriers, and closing it will take the kind of sustained, personal, early work that the research points to.
For now, the direction is clear. Chronic absenteeism is falling in almost every state that reports it, and it is falling steadily. Families, teachers, and schools can check the numbers themselves with the free attendance percentage calculator, which turns days attended and total days into a percentage in seconds.