 Skip to main content


Every teacher and school administrator eventually needs one number that sums up how present a class really is: the average attendance of students. An individual attendance percentage tells the story of one learner, but the class average tells the story of the whole group, feeding into monthly reports, parent-teacher meetings, and decisions about where extra support is needed.
This guide walks through how to calculate average attendance of students: the core formula, two practical methods, three fully worked examples, a spreadsheet shortcut, common mistakes, and benchmarks for Indian schools and colleges. No special software is needed.
What “Average Attendance of Students” Actually Means
Average attendance of students is the share of all possible attendances actually recorded, expressed as a percentage. A class of 30 students meeting for 20 days has 600 possible attendances; if the register shows 553, the average is 92.17 percent.
It differs from an individual student’s attendance percentage, which covers one learner only; the class average rolls every student’s record together. A class can have an average attendance of 92 percent while individual students range anywhere from 70 percent to 100 percent, which is exactly why both numbers matter: the average shows the health of the group, and individual figures flag who needs help. Readers who want the individual side first can review how to calculate attendance percentage for a single student.
Average attendance is also sometimes described in non-percentage terms, such as “an average of 27.6 students present per day.” Both readings come from the same underlying numbers, and this guide covers both.
The Core Formula for Average Attendance
The formula works at any scale, from one section to a whole school:
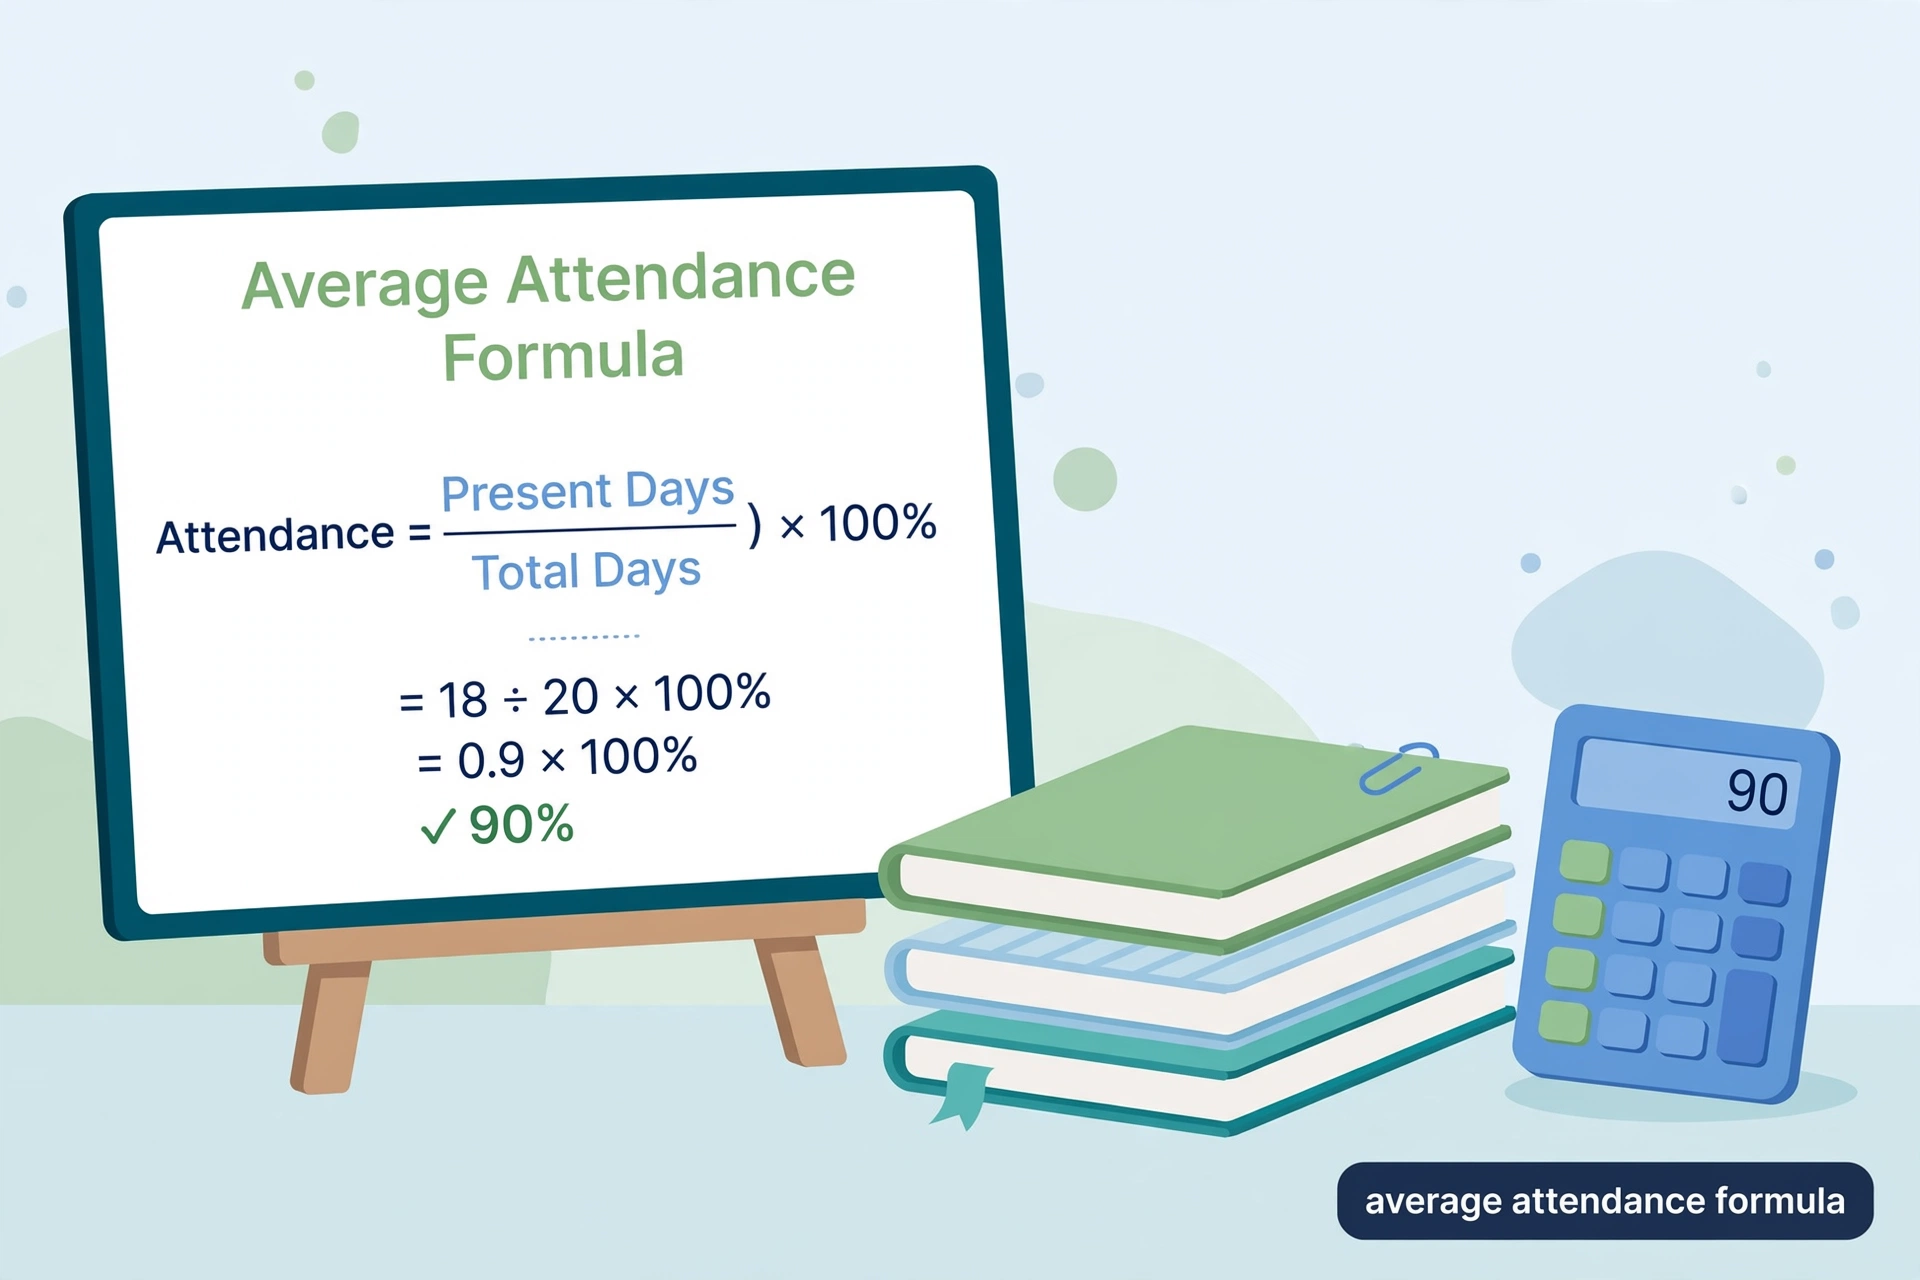
Average attendance (%) = (Total attendances recorded / Total possible attendances) x 100
The two inputs need a little unpacking:
- Total attendances recorded: the sum of the “present” counts from every school day in the period.
- Total possible attendances: the number of students multiplied by the number of school days in the period. A class of 30 students over 20 school days has 600 possible attendances.
One division and one multiplication give the answer; the rest of this guide covers gathering those inputs correctly and handling wrinkles like mid-term admissions and half-days.
Method 1: The Headcount Method (Step by Step)
The headcount method is the most direct approach, and most school registers are already set up for it.
Step 1: Fix the period. Decide whether the average covers a week, a month, or a term. Write down the start and end dates.
Step 2: List every school day in the period, counting only days school was actually in session. Sundays, public holidays, and closure days stay out of the denominator.
Step 3: Record the present count for each day from the attendance register.
Step 4: Add up all the daily present counts. This total is the “total attendances recorded.”
Step 5: Multiply the number of students on roll by the number of school days. This is the “total possible attendances.”
Step 6: Divide total attendances by total possible attendances, multiply by 100, and round to one or two decimals.
This method is the fastest when working directly from the daily register, since no individual percentages are needed.
Method 2: Averaging Individual Attendance Percentages
The second method starts from the other end. First compute each student’s individual attendance percentage for the period, then take the simple average of those percentages.
For example, suppose five students have individual attendance percentages of 96, 92, 88, 90, and 94 percent. Adding them gives 460, and dividing by 5 gives a class average of 92 percent.
When every student was enrolled for the full period, both methods give the same answer. Method 2 shines when students joined or left mid-period, since each student’s percentage already accounts for their own denominator, and it pairs naturally with digital registers that show per-student percentages automatically. For a simple, stable class, Method 1 is quicker.
Worked Example: A Class of 30 Students Over 20 Days
Applying the headcount method to a realistic register: a class of 30 students, 20 school days in session, with these daily present counts:
Day 1: 29, Day 2: 28, Day 3: 30, Day 4: 27, Day 5: 26, Day 6: 28, Day 7: 29, Day 8: 25, Day 9: 27, Day 10: 28, Day 11: 30, Day 12: 29, Day 13: 24, Day 14: 26, Day 15: 28, Day 16: 27, Day 17: 29, Day 18: 26, Day 19: 28, Day 20: 29.
Adding all twenty figures: 29 + 28 + 30 + 27 + 26 + 28 + 29 + 25 + 27 + 28 + 30 + 29 + 24 + 26 + 28 + 27 + 29 + 26 + 28 + 29 = 553 total attendances.
Total possible attendances = 30 students x 20 days = 600.
Average attendance = (553 / 600) x 100 = 92.17 percent.
In headcount terms, that is 27.65 students present per day on average (553 / 20), the same 92.17 percent expressed differently.
Worked Example: New Admissions and Dropouts Mid-Term
Real classes change. Students take admission after the term begins, and occasionally a student leaves. The fix is simple: each student contributes to the denominator only for the days they were actually on roll.
Suppose a class begins the term with 30 students and runs for 20 school days. After day 10, two new students join, so they are on roll for days 11 through 20 (10 days each).
Total possible attendances = (30 students x 20 days) + (2 students x 10 days) = 600 + 20 = 620.
If the register shows 540 total attendances, the average attendance = (540 / 620) x 100 = 87.10 percent.
Ignoring the mid-term admissions would give 90 percent, overstating attendance by nearly three points. For a student who leaves mid-period, count only the days before they left; with heavy mid-term movement, Method 2 is usually cleaner since each student’s percentage already handles their personal denominator.
Worked Example: Half-Days, Late Arrivals, and Partial Attendance
Registers do not always deal in neat full days. A common policy is to count a half-day presence as 0.5 attendances. Late arrivals are usually counted as full attendances unless the school’s policy says otherwise, but the key is consistency: whatever rule is chosen must be applied to every day in the period.
Consider a class of 25 students over 10 school days, where day 6 was a half-day for the whole school and 22 students attended it.
Total possible attendances = 25 x 10 = 250, but day 6 contributes at most 12.5 attendances (25 x 0.5), not 25. So the adjusted denominator is (25 x 9) + 12.5 = 237.5.
If the register shows 218 full attendances on the nine normal days plus 22 half-day attendances on day 6 (counted as 11), total attendances = 229.
Average attendance = (229 / 237.5) x 100 = 96.42 percent.
Without the half-day adjustment the denominator would be 250 and the reported average an unfair 91.6 percent, so these policy choices are worth writing down for anyone reading the report.
Average Attendance vs Average Daily Attendance (ADA)
These two terms overlap heavily but come from different traditions. Average daily attendance, or ADA, is the total days of student attendance divided by the number of instructional days in the period. In practice, ADA computed for one class is the same number as the class average attendance expressed as a headcount (27.65 students per day in the first example above).
The distinction matters mostly for reporting: in the United States, ADA is an official funding metric used to allocate school funding, while Indian schools more commonly report the percentage form. The underlying arithmetic is identical.
Both metrics share one blind spot: they describe the group, not individuals. A class can post 94 percent while a handful of students miss a third of all classes, which is why schools increasingly pair the average with a chronic-absence measure (missing 10 percent or more of school days). The average shows whether the class is healthy; the chronic-absence count shows who needs intervention.
How to Calculate Average Attendance in Excel or Google Sheets
Once the register is typed in, a spreadsheet removes the arithmetic. Put daily present counts in one column, for example cells B2 through B21 for 20 days.
To get total attendances, use =SUM(B2:B21). If the class strength sits in cell A1 and the number of school days in cell A2, the average attendance percentage is =SUM(B2:B21)/(A1A2)100.
For Method 2, list each student’s present days and possible days in adjacent columns, compute each row’s percentage, and finish with =AVERAGE(C2:C31).
Two tips make this robust: keep a small table of school days per month so holidays never sneak into the denominator, and use conditional formatting to flag any daily count more than 10 percent below the running average, turning the sheet into an early-warning tool.
5 Common Mistakes That Skew the Result
Mistake 1: Including holidays and Sundays in the denominator. Every non-school day in the denominator drags the percentage down unfairly. Count instructional days only.
Mistake 2: Inconsistent treatment of late arrivals. If latecomers count as present on some days and absent on others, the register is measuring the teacher’s mood, not attendance. Pick one rule and document it.
Mistake 3: Forgetting mid-term admissions and withdrawals. As the worked example showed, ignoring roll changes can shift the result by several percentage points.
Mistake 4: Rounding too early. Rounding daily figures or individual percentages before averaging introduces compounding errors. Keep full precision until the final step.
Mistake 5: Mixing excused and unexcused absences without saying so. For the average itself, an absence is an absence, but reports should state the policy. Some schools track the two separately for intervention purposes while keeping the headline average all-inclusive.
What Counts as a Good Average Attendance?
Widely used bands for Indian schools and colleges:
- 95 percent and above: excellent. The class is highly engaged; keep doing what works.
- 90 to 95 percent: good. Normal, healthy attendance with room for small improvements.
- 85 to 90 percent: needs attention. Patterns are worth investigating, such as specific weekdays or subjects with dips.
- Below 85 percent: concerning. This usually signals systemic issues rather than individual choices, and it deserves a proper review.
For colleges, the widely known 75 percent attendance rule sets the minimum an individual student typically needs to be eligible for examinations, which is a different question from the class average but a useful reference point when interpreting the numbers. A class averaging 88 percent will still contain students below that 75 percent line who need individual follow-up.
What to Do When the Class Average Slips
A falling average is a signal, not a verdict. First, break it down: average by weekday to spot Monday or Friday dips, and by subject to spot timetable problems. Weekly tracking catches a slide far earlier than term-end reporting.
Next, talk to the students behind the numbers before assuming disengagement. Transport problems, health issues, exam anxiety, and part-time work are common, fixable causes. Students who are worried about their own record can also check how many classes they can miss before slipping below important thresholds, which often motivates a quicker turnaround.
Schools that treat attendance data as a diagnostic tool rather than a compliance exercise see better results; Attendance Works case studies show how monitoring patterns and responding with targeted support reduced chronic absence dramatically. Their chronic absence resources are a useful next read for any school building an attendance improvement plan.
Finally, review the monthly average in the first week of the following month, while there is still time to act.
Frequently Asked Questions
What is the difference between average attendance and attendance percentage?
Attendance percentage usually describes one student: days present divided by expected days, times 100. Average attendance rolls the whole class together: total recorded attendances divided by total possible attendances, times 100.
Should holidays be included when calculating average attendance?
No. Only days school was actually in session belong in the denominator; including Sundays, holidays, or strike days artificially lowers the percentage and breaks month-to-month comparisons.
How do you calculate average attendance when students join mid-term?
Count each student only for the days they were on roll. Multiply each student’s enrolled days by one, add those up for the denominator, and divide total recorded attendances by that adjusted total. Alternatively, compute each student’s individual percentage first and average those.
Is average attendance the same as average daily attendance (ADA)?
For a single class the arithmetic is effectively the same: total attendances divided by instructional days. ADA is the term most used in American school funding, where it is often reported as a headcount per day rather than a percentage.
How often should teachers calculate average attendance?
Monthly is the sweet spot: frequent enough to catch problems early without becoming a burden, with weekly checks as a supplement during exam terms.
Can average attendance ever exceed 100 percent?
No, not if it is calculated correctly. The numerator (recorded attendances) can never exceed the denominator (possible attendances). A figure above 100 percent always means an error, usually holidays counted as school days in the numerator but not the denominator, or a data-entry slip.
Why does the class average look fine while some students miss a lot?
Because averages hide distribution, schools pair the average with individual tracking, so the group metric and the individual metric do their separate jobs.


