

On a school morning in Phoenix, the attendance register tells a story that has not changed as much as many people hoped. Nearly one in four Arizona pupils in grades 1 to 8 missed enough school in 2025 to count as chronically absent, a rate almost double the one the state recorded before the pandemic. The number has come down from its worst point, but the picture remains stubborn.
The latest reporting sets out the scale of the problem, then looks at the places fighting back: a county-wide initiative coaching districts in Maricopa County, and one West Valley district whose home-grown early-warning system has cut its rate well below the state average. The question is whether those gains can survive the setbacks that undid progress once before.
At a glance: Nearly 25% of Arizona students in grades 1–8 were chronically absent in 2025, against 13% in 2019. The rate peaked at 34% in 2021–22 and has fallen since, but it is still far above where it started. High school rates are higher still, at 34% after a 42% peak. In Buckeye, one district has cut its rate to 19.3%.
The Numbers, Side by Side
Chronic absence has a precise meaning in Arizona. A student counts as chronically absent when they miss 10 percent or more of the school year, for any reason, excused or unexcused. With a 180-day school year, that works out to 18 days — and missing just one or two days every month is enough to cross the line. Readers who want to work with the same measure can see how to calculate the absenteeism rate for a single school or classroom, using the same 10 percent threshold the state applies.
| Group | Before the pandemic (2019) | Pandemic peak (2021–22) | Latest reported |
|---|---|---|---|
| Grades 1–8 | 13% | 34% | About 25% in 2025 |
| High school (grades 9–12) | Not stated in the latest reporting | 42% | 34% in 2023–24 |
The state’s School Report Cards put the overall statewide rate at 24 percent — a slightly different group, but pointing the same way.
The direction is encouraging, but the distance still to go is large. Grades 1–8 improved from the 34 percent peak to 29 percent in 2022–23, and high school rates fell from 42 percent to 34 percent. Yet both latest rates sit well above the pre-pandemic baseline — and for the younger grades, the 2025 figure is still almost double the 2019 level.
Why does that gap matter? Because missing school and falling behind travel together: the Helios analysis titled Still Missing Too Much School found chronic absence strongly correlates with lower performance in maths, English language arts and overall coursework — an early signal of how a pupil is doing, visible months before test results arrive.
Why the Rate Climbed — and Why It Is Sticking

The first explanation, in reporting by Cronkite News, is a habit formed during the pandemic. Paul Perrault, a senior vice president at the Helios Education Foundation, argues that families grew accustomed to a different rhythm: keeping a child at home stopped feeling unusual, and for some the child at home became part of how the household functioned — helping with childcare, or in a family business. When school returned to normal, the old routine did not automatically return with it.
The Barriers Beyond the School Gate
A second explanation looks outside the classroom. Dawn Gerundo, a community development and engagement director at Valley of the Sun United Way, points to the practical obstacles that keep children away: families without reliable access to healthcare, dental care or food banks. A child with an untreated toothache, or a household worrying about the next meal, finds it harder to turn up every morning — and the reasons differ from one family to the next.
Gerundo’s summary: there is no single cause to fix, so no single policy handed down from above is enough. The Arizona response is therefore local, personal work built around relationships rather than rules.
Project SAAM: A County-Wide Answer
Valley of the Sun United Way, a Phoenix nonprofit serving Maricopa County, has launched an initiative called Supporting Attendance Across Maricopa County — Project SAAM — with funding from the Helios Education Foundation. The project will provide coaching and other support for three years in selected Arizona school districts, including Phoenix Union High School District, Avondale Elementary School District and Cartwright Elementary School District.
The approach is hands-on. United Way has worked with schools to build attendance teams and review attendance data regularly, so pupils and families who may need support are spotted early. It has also run events at local schools to draw families into their children’s learning — including a digital literacy night at Lattie Coor School in Avondale — which the organisation says has led to higher attendance and better learning results.
Lindsay Kent, a community development and engagement manager at United Way, describes the work as relationship building first and foremost: families should not feel attacked when the school calls, but feel the call comes from understanding and care. The school becomes a partner asking what is wrong, rather than an authority asking where the child has been.
That change of tone matters because the old tone was part of the problem: in Buckeye, staff found some families felt called out, and a child embarrassed about missing school is less likely to come back. The response in both places is the same — change the conversation first, and the attendance follows.
Frequently Asked Questions
What counts as chronic absenteeism in Arizona?
A student is chronically absent when they miss 10 percent or more of the school year. With a 180-day school year, that means 18 days or more. Missing one or two days a month is enough to reach the threshold, so small, regular absences matter as much as long ones.
How high is chronic absenteeism in Arizona now?
Nearly 25 percent of pupils in grades 1–8 were chronically absent in 2025, according to the Helios Education Foundation, against 13 percent in 2019. High school rates stood at 34 percent in 2023–24, down from a 42 percent peak. The state’s School Report Cards put the overall statewide rate at 24 percent.
What is Project SAAM?
Project SAAM — Supporting Attendance Across Maricopa County — is a three-year Valley of the Sun United Way initiative, funded by the Helios Education Foundation. It coaches selected Maricopa County districts, including Phoenix Union, Avondale Elementary and Cartwright Elementary, on building attendance teams and using data to spot struggling pupils early.
How did Buckeye Elementary cut its chronic absenteeism rate?
Buckeye built a tiered action plan in every school, backed by a home-grown early-warning tool called Attend33 that flags pupils before they cross the line. Teachers call families using supportive phone scripts, pupils with a history of absences get a daily check-in with an adult at school, and time is set aside to catch up on missed work. The district rate fell 3.8 points to 19.3 percent in 2025–26.
Which pupils are most at risk of chronic absence in Arizona?
In Buckeye, the groups watched most closely are pupils experiencing housing instability, chronically absent at more than twice the district rate; kindergartners, since attendance is not legally required in Arizona until age six; and pupils managing chronic illness. Statewide, the Helios analysis found higher absence rates among pupils already behind in maths and reading.
Inside Buckeye: How One District Beat the State Average
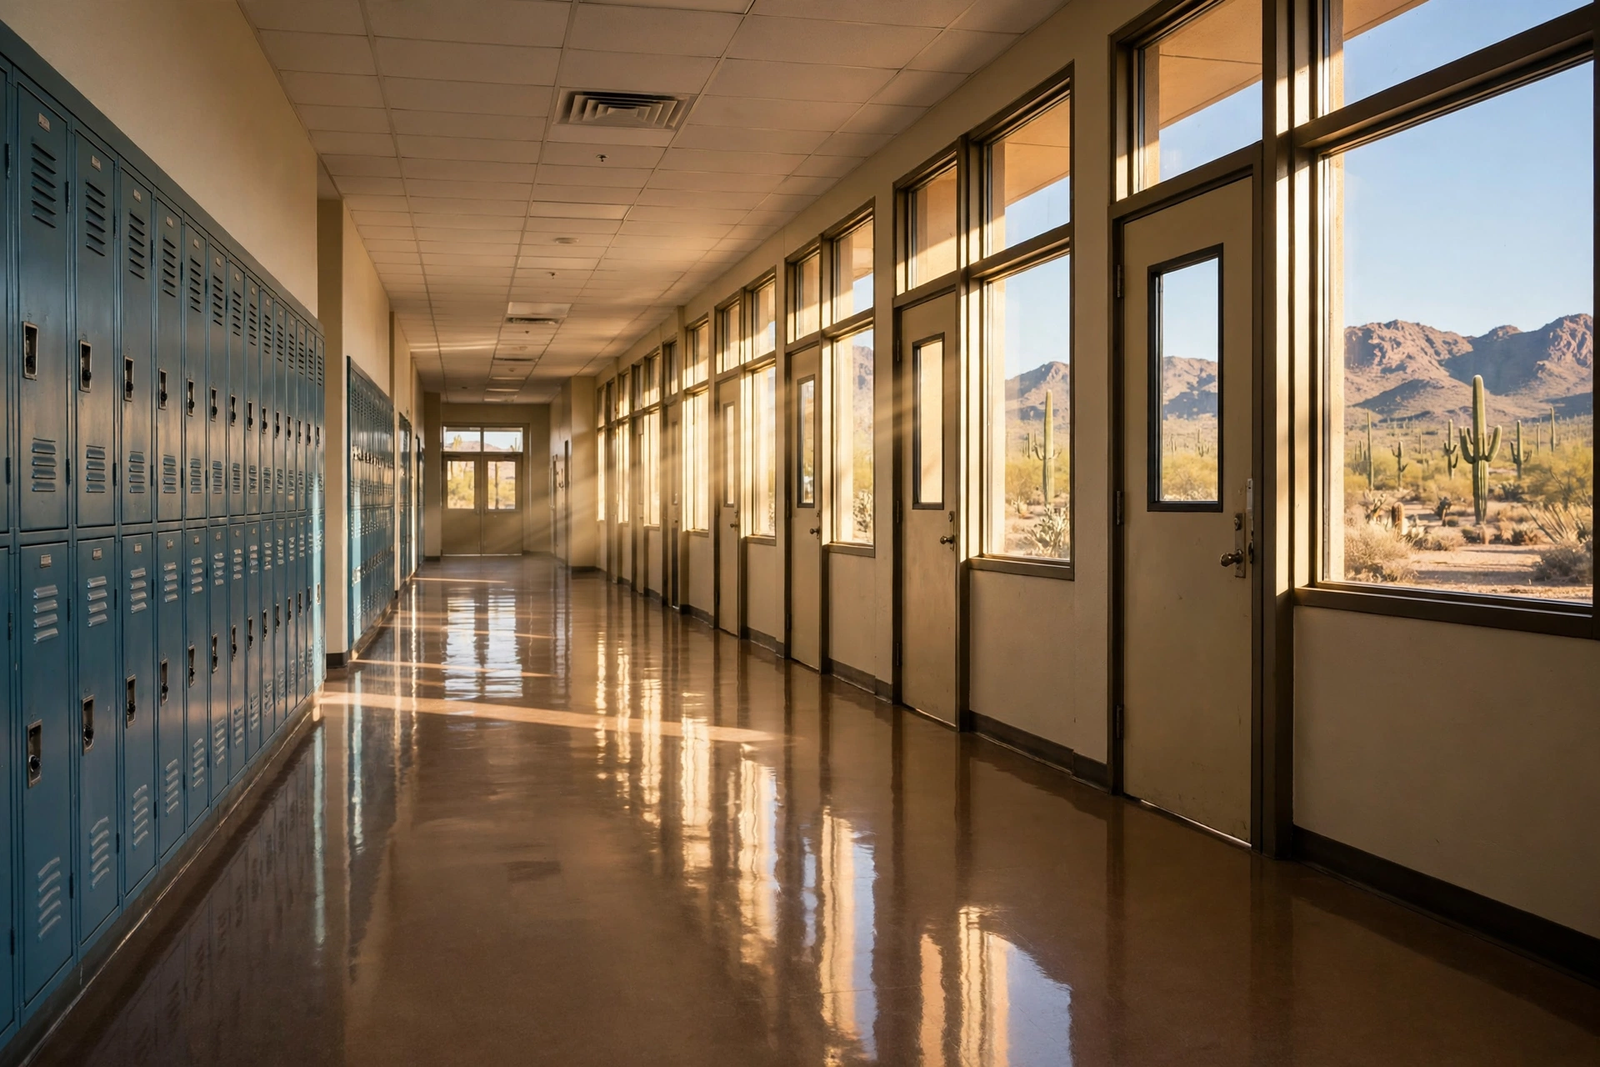
Buckeye Elementary School District, in the West Valley, is the clearest proof the statewide rate can be beaten. In 2025–26, every school built a tiered chronic absenteeism action plan on a common district template, and every school lowered its rate. Districtwide, the rate fell 3.8 points to 19.3 percent — well below the statewide 24 percent.
The improvement did not arrive all at once. Between 2021–22 and 2023–24, all seven schools with comparable data brought their rates down, and Bales Elementary fell from about 41 percent to 22 percent. Then, in 2024–25, rates rebounded at every school — so the 2025–26 recovery is a second climb, not a first.
Step 1: Watch the Data at Three Levels
Buckeye watches attendance at three levels: teachers report when a pupil reaches three absences, each school reviews its own attendance weekly, and the district runs a monthly tracker covering all schools. Together they mean a pupil who starts to slip is noticed within days, not months.
Step 2: Let the Tool Flag Pupils Before They Cross the Line
The biggest change, according to Kara McDivitt, the district’s director of student services, is a tool called Attend33, built in-house by the district’s technology coordinator, Ronnie Roberts. Instead of a static spreadsheet, staff get data they can sort, filter and act on. The tool measures every pupil against the days the school was actually in session, so the percentages reflect real attendance.
Buckeye is now working with the Education Technology Consortium at Northern Arizona University to automate nightly data exports from its student information system, giving staff near real-time figures. When complete, the system will sort pupils into tiers at 95 percent and 90 percent attendance, showing staff who has not yet crossed the line — where a small intervention still has time to work.
The tool has already proved its value. At one point last year it showed 479 pupils sitting at 13 to 16 absences — close to the threshold, but still with time to change course. It also flags on its own whenever any pupil group falls five points or more behind the district as a whole, so a gap affecting one group does not hide inside the district average.
Step 3: Change How the School Talks to Families
Technology alone did not produce the improvement. The district investigated what families were saying when low attendance was discussed, and what it heard changed the approach: some families felt called out, and a child embarrassed about missing school is less likely to come back — so the schools changed the conversation.
Teachers now use written phone scripts, so calls to families are supportive and consistent. Pupils with a history of absences are paired with an adult at the school for a daily check-in, and schools set aside time for them to catch up on missed work, so returning does not feel overwhelming. Each step is small; together, they remove the reasons a child might stay away a second day after missing the first.
Step 4: Watch the Groups Most at Risk
The district also tracks which pupils are most likely to slip: pupils experiencing housing instability, chronically absent at more than twice the district rate; kindergartners, since attendance is not legally required in Arizona until age six; and pupils managing chronic illness. Naming those groups matters, because a district-wide average can hide a serious problem in one group. For parents weighing what the rules require, it is worth knowing whether attendance is compulsory in their state.
The Warning in the Data: One Good Year Is Not Proof
For all the progress in Buckeye, its director sounds a note of caution. McDivitt describes the system as still fragile: the gains of 2021–22 to 2023–24 did not hold in 2024–25. Much of that rise, she says, traced to events outside school — a social media threat, and families’ fear of immigration enforcement. The threat was a case of mistaken identity: posts about a school shooting threat concerned Buckeye, Ohio, but spread and pupils believed they were about Buckeye, Arizona. The fear was real even though the threat was not, and attendance fell.
The lesson is that a single good year proves very little: attendance is fragile, and can be knocked off course by events no school controls. That is why the district built a system to catch a slip early rather than a campaign to produce one good year. The real test is the 2026–27 school year — as of September, most Buckeye schools are even with or ahead of last year, and two are creeping up. The system caught that early, which is exactly what it was built for.
The same caution applies statewide: the Helios figures show a slow recovery, and the gap to the pre-pandemic rate is still wide. The work is not finished when the rate falls — it is finished when the rate stays down through a difficult year.
What Families Can Check This Week
Count the days so far. With a 180-day year, 18 days is the line. A quick count of days missed since the start of term shows whether a child is close to it — a simple average attendance formula makes that check a matter of minutes.
Watch the pattern, not just the total. One or two days a month, every month, adds up to the same total as a single long absence — and it is easier to miss. If the same weekday keeps disappearing, raise it with the school before it becomes a habit.
Ask the school what support exists. Attendance teams, check-in adults and catch-up time now exist in a growing number of districts, but families often do not know to ask. A short call to the school office can surface options never offered.
Treat September as the forecast. The first weeks of term set the pattern for the year, and the districts making progress act on early data. If a child has already missed several days, raise it with the school now, while most of the year is left to turn it around.
Keep the return easy. Buckeye’s experience is that children stay away when coming back feels hard — missed work piled up, embarrassment about the gap. Asking the teacher what was missed, and setting aside time to catch up, removes the most common reason a one-day absence becomes a second.
Arizona’s schools are tackling a problem that has outlasted the emergency that created it. The statewide rate is falling, the tools are getting better, and one district has shown what is possible when data, technology and a kinder conversation come together. The work now is to make that normal rather than the exception — and to hold the gains when the next difficult year arrives.
For a quick check, the free attendance percentage calculator at the top of this site turns days attended and days missed into a clear percentage in seconds.